The Ultimate Bet Tracker Guide: Analytics for Sharps

Key Takeaways
- The CLV Imperative: Tracking Closing Line Value is more predictive of long-term success than tracking Win/Loss records; consistently beating the close proves a sustainable edge.
- Segmentation is Key: You must tag and filter bets by sport, market type, and timing to identify exactly where you are profitable and where you are leaking bankroll.
- Psychological Defense: A tracker mitigates 'tilt' by shifting focus from short-term variance (game results) to process-oriented metrics (price obtained).
- The True Audit: Regular quarterly reviews of your data are necessary to cut losing strategies and reallocate capital to high-ROI market segments.
Definition
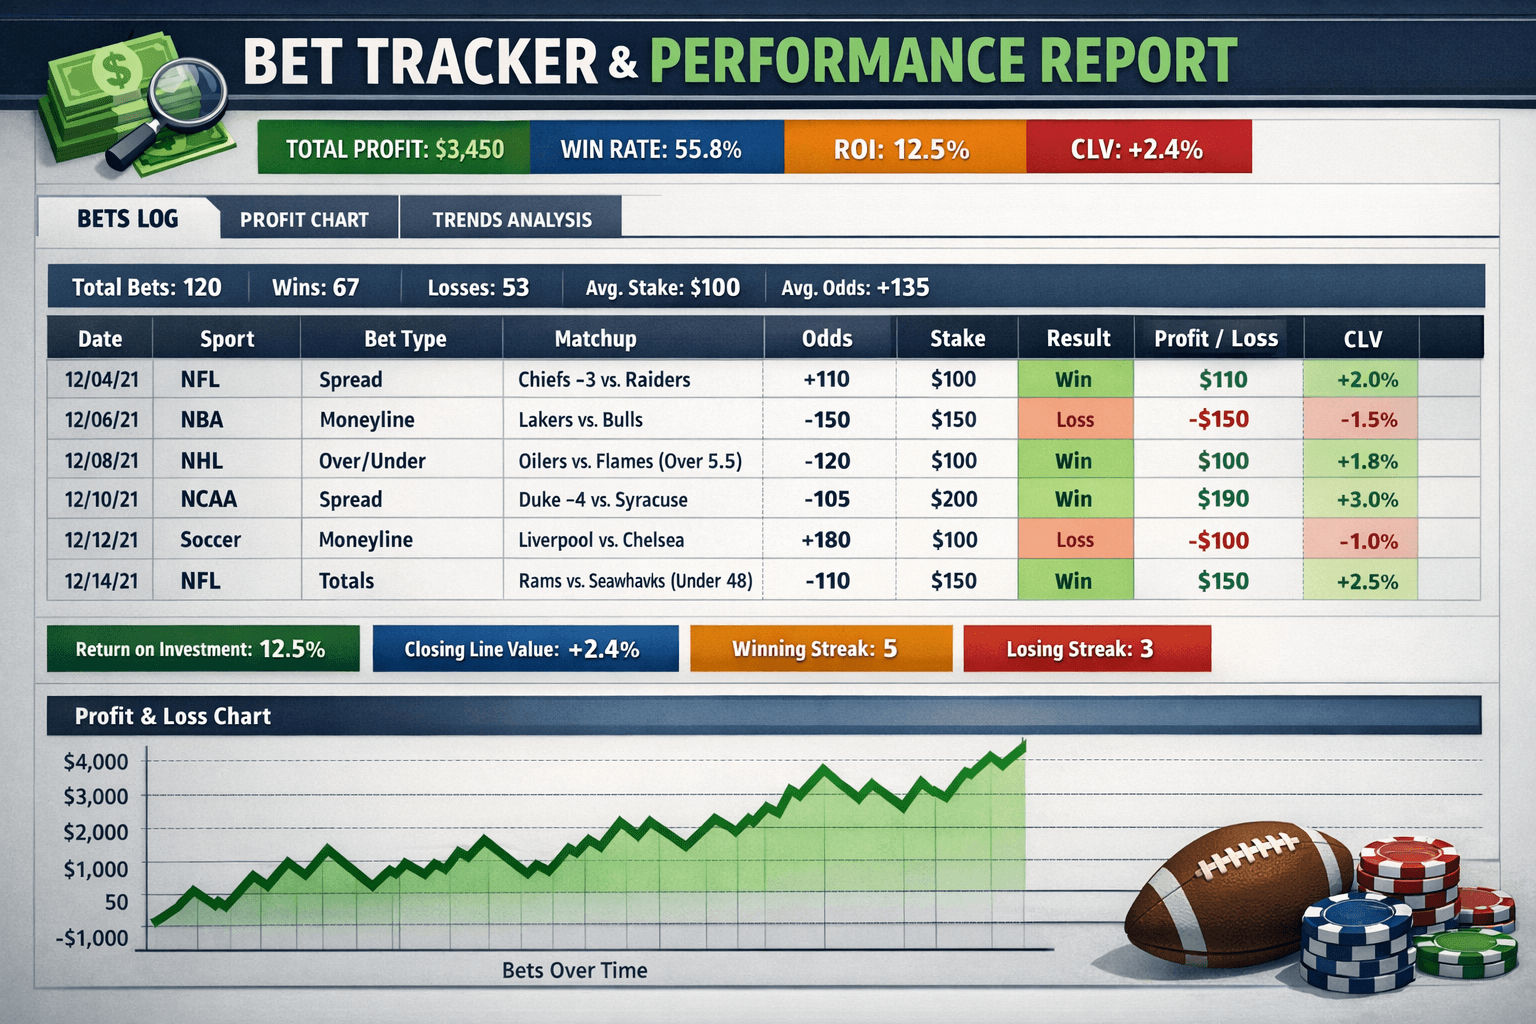
A bet tracker is a systematic record-keeping tool—often a spreadsheet or dedicated software—used by sports bettors to log wager history, analyze performance metrics like ROI and Closing Line Value (CLV), and identify profitable or losing trends in their strategy. It serves as the "Profit & Loss" statement for a bettor treating their hobby as an investment class.
Table of Contents
If you are treating sports betting as an investment rather than a form of entertainment, your most valuable asset is not your bankroll, your handicapping model, or your access to information. It is your data.
Most bettors operate in a fog of recency bias. They remember the bad beat from last night and the parlay that hit two weeks ago, but they lack an objective view of their long-term performance. They cannot tell you their Return on Investment (ROI) by sport, their win rate on player props versus main lines, or, most critically, whether they are consistently beating the closing line.
This is where a professional-grade bet tracker becomes non-negotiable. It is the ledger of your business. Without it, you are simply gambling. With it, you are gathering the intelligence required to become a sharp.
The Philosophy of Tracking: Why Variance Hides Truth#
In the short term, luck dominates skill. You can make a terrible bet with negative expected value (-EV) and win. You can make a mathematically perfect bet with significant +EV and lose. In a sample size of 50 or 100 bets, your bankroll’s fluctuation is largely noise.
A bet tracker allows you to pierce through that variance. By logging data over hundreds and thousands of wagers, the noise cancels out, and the signal of your actual edge emerges.
For the semi-pro and sharp bettor, the tracker serves three distinct psychological and analytical purposes:
- Accountability: It prevents you from lying to yourself about your profitability.
- Optimization: It highlights specific "leaks" in your game (e.g., "I am down 12 units on live betting this year").
- Process Validation: It shifts your focus from the result of the bet (which you can't control) to the price of the bet (which you can).
Key Metrics: Beyond Wins and Losses#
A novice tracks wins, losses, and profit. A sharp tracks the metrics that predict future success. When building or selecting a bet tracker, these are the Key Performance Indicators (KPIs) you must monitor.
Closing Line Value (CLV)
This is the holy grail of sports betting analytics. CLV measures the odds you bet against the odds at market close (when the game started). The closing line is generally considered the "efficient" market price because it reflects all available information and the maximum volume of liquidity.
If you bet the Chiefs at -3 (-110) and the line closes at Chiefs -3.5 (-110), you have generated CLV. You bought a stock for a cheaper price than it is currently trading. Even if the Chiefs lose, that bet was a "good" bet.
Your tracker must include:
- Bet Odds: The price you paid.
- Closing Odds: The price at tip-off/kick-off.
- CLV %: The percentage difference in implied probability between the two.
If your tracker shows positive ROI but negative CLV over a large sample, you are likely running hot and regression is coming. If you have negative ROI but strong positive CLV, you are likely running cold, and profits should follow.
Return on Investment (ROI) vs. Return on Capital (ROC)
ROI is your total profit divided by your total volume wagered. It measures the efficiency of your betting engine. A 3% ROI in sports betting is considered elite, provided you have high volume.
However, you should also track the growth of your starting bankroll (ROC). A high ROI is useless if you aren't turning over your bankroll enough times.
The Kelly Fraction
Are you over-staking? Your tracker should log your stake size relative to your bankroll percentage. Correlating stake size with win rate helps you identify if you are bleeding money by betting too big on lower-confidence plays, or leaving money on the table by betting too small on your highest-edge plays.
Building Your Stack: Spreadsheet vs. Software#
There is a perennial debate in the community: should you build a custom Excel/Google Sheets tracker or use an automated app?
The Case for Spreadsheets
For the data scientist or the control freak, a custom spreadsheet is often superior. It allows for infinite customizability. You can build pivot tables to analyze performance by:
- Time of day (Are you betting too early/late?)
- League/Conference (Are you crushing the MAC but losing in the SEC?)
- Bet Type (Moneyline vs. Spread vs. Total vs. Prop)
Essential Columns for your Spreadsheet:
- Date: Format as YYYY-MM-DD for sorting.
- Sport/League: Standardize these tags (e.g., use "NBA", not "Basketball").
- Fixture: Home vs. Away.
- Selection: What you bet on.
- Bookmaker: Vital for tracking account balances across multiple outs.
- Stake: In currency and units.
- Odds: Decimal format is easier for calculations than American.
- Result: Win/Loss/Push.
- Closing Odds: To calculate CLV.
- Tags: Custom notes (e.g., "Tail", "Model V2", "Arbitrage").
The Case for Automated Tools
Manual tracking requires discipline. If you forget to log a losing day, your data is corrupted. Automated trackers that sync with your sportsbooks ensure 100% data integrity. They also save time, allowing you to focus on origination rather than data entry.
However, be wary of "free" trackers that sell your data to books. If you use a third-party tool, ensure you can export your data to CSV so you maintain ownership of your history.
Analyzing Your Data: Finding the Leaks#
Once you have a sample size of 500+ bets, you need to perform a quarterly audit of your tracker. This is where you act as the CEO of your betting fund.
The "Sport Split" Analysis
It is common for bettors to have a massive edge in one sport that subsidizes losses in another. You might be +15% ROI in NFL props but -8% ROI in NBA sides. A tracker reveals this brutally honest truth. The strategic move here is difficult but necessary: stop betting on the sports where you have no edge, or significantly reduce your unit size until your modeling improves.
The "Market Type" Analysis
Are you beating main markets (Sides/Totals) or derivative markets (Props/Quarters)? Main markets are efficient and harder to beat. If your tracker shows you are crushing player props but breaking even on game totals, you should reallocate your bankroll liquidity toward props.
This is often where tools like a Live +EV Feed become critical. By sourcing bets from a proven +EV feed and tagging them in your tracker, you can separate your "originated" bets (bets you found yourself) from "feed" bets. This allows you to audit the performance of the tools you use versus your own intuition.
The "Timing" Analysis
Filter your bets by how far in advance of the game they were placed. You will likely find a strict correlation: Early bets (opening lines) have higher CLV and ROI than late bets (game day). If your tracker shows you are losing money on bets placed within one hour of game time, you are likely reacting to public information rather than anticipating it.
Advanced Tagging Strategies#
To truly unlock the power of a bet tracker, you must use a robust tagging system. Do not just log the bet; log the reason for the bet.
Recommended Tags:
- Model_Algo: Bets derived purely from your data model.
- Steam_Chase: Bets made following a major line move.
- Promo_Boost: Bets taking advantage of a sportsbook odds boost.
- Live_InGame: Wagers placed after the event started.
- News_Injury: Bets based on breaking injury news.
By filtering for these tags, you might discover that your "News_Injury" bets generate a 12% ROI, while your "Live_InGame" bets generate a -5% ROI. The actionable insight? Stop betting live and focus more on monitoring Twitter/X for injury news.
The Mental Edge: Detachment from Results#
Perhaps the most underrated aspect of a bet tracker is its ability to mitigate "tilt." Tilt occurs when emotional distress causes you to make irrational betting decisions, usually chasing losses.
When you lose a bet but can look at your tracker and see that you beat the closing line by 20 cents, you can take solace in the math. You made a correct decision; the variance just went against you. Conversely, if you win a bet but see you beat the line by 0 cents (or worse, got a worse price than the close), the tracker keeps you humble. It reminds you that you got lucky, not smart.
This detachment is the hallmark of a professional. You stop sweating the fourth quarter of a random Tuesday night game and start focusing on the aggregate performance of your portfolio over the quarter or year.
Handling Multi-Leg Wagers (Parlays/Teasers)#
Tracking straight bets is easy. Tracking parlays is complex but necessary. Many bettors avoid tracking parlays because the variance is so high it messes up their beautiful spreadsheet graphs.
Do not do this. If you bet it, you must track it.
For parlays, you should track the "True Odds" versus the "Book Odds."
- True Odds: The parlay odds based on the fair no-vig probability of each leg.
- Book Odds: The odds the book gave you.
If the Book Odds are higher than the True Odds, the parlay had +EV. If not, you are burning money. Over time, your tracker will likely show that uncorreclated parlays are a drain on your ROI, whereas correlated parlays (SGP) might offer value if modeled correctly.
Conclusion: Data is the Differentiator#
In the ecosystem of sports betting, the bookmakers have better data, faster feeds, and more money than you. The only advantages you can cultivate are discipline and selectivity. A bet tracker is the infrastructure that supports both.
It transforms "feelings" into facts. It turns a chaotic gambling habit into a structured quantitative pursuit. If you are serious about finding an edge, stop watching the scoreboard and start watching your spreadsheet.
Frequently Asked Questions
Why is Closing Line Value (CLV) important to track?▼
How do I calculate betting ROI?▼
Should I use Excel or an app for tracking bets?▼
What is a good sample size for analyzing betting results?▼
How should I track parlay bets?▼
Related Articles
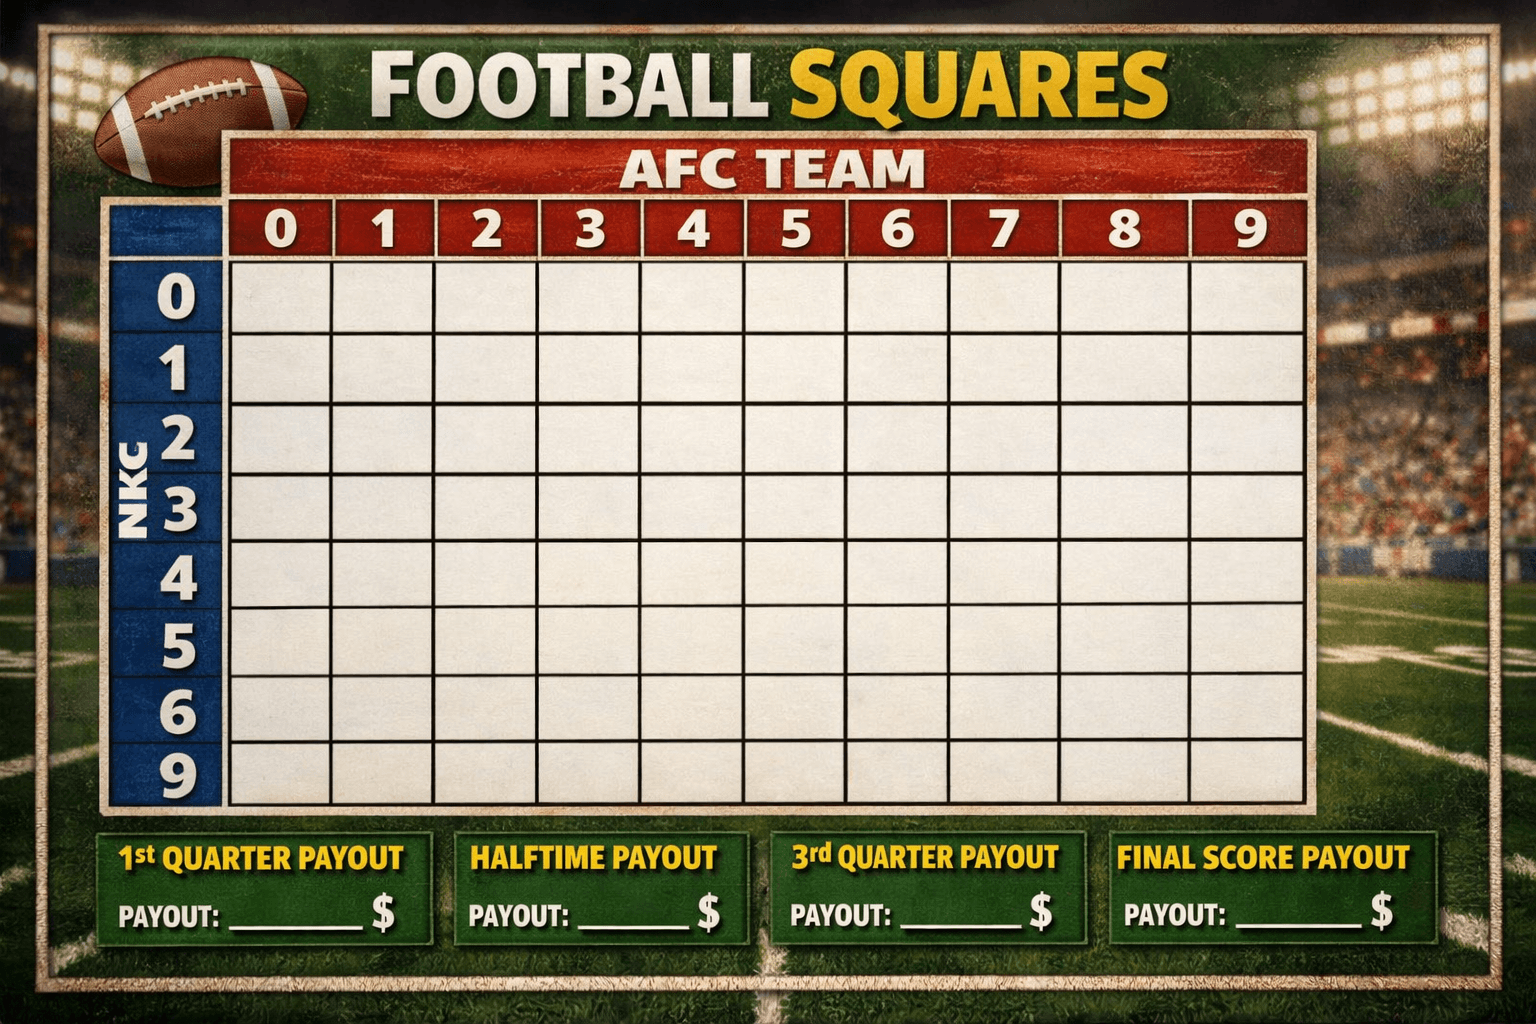
Football Squares Rules: The Definitive Analytics & Strategy Guide
Master football squares with this data-driven guide. Learn the rules, optimal number probabilities, auction valuation strategies, and how to gain an edge in high-stakes pools.
.png&w=3840&q=75)
Middling in Sports Betting: The Math Behind the Most Profitable Play
Master the art of middling. Learn how to exploit line movements to create risk-free windows where you win both sides of a bet. Advanced strategy for sharps.
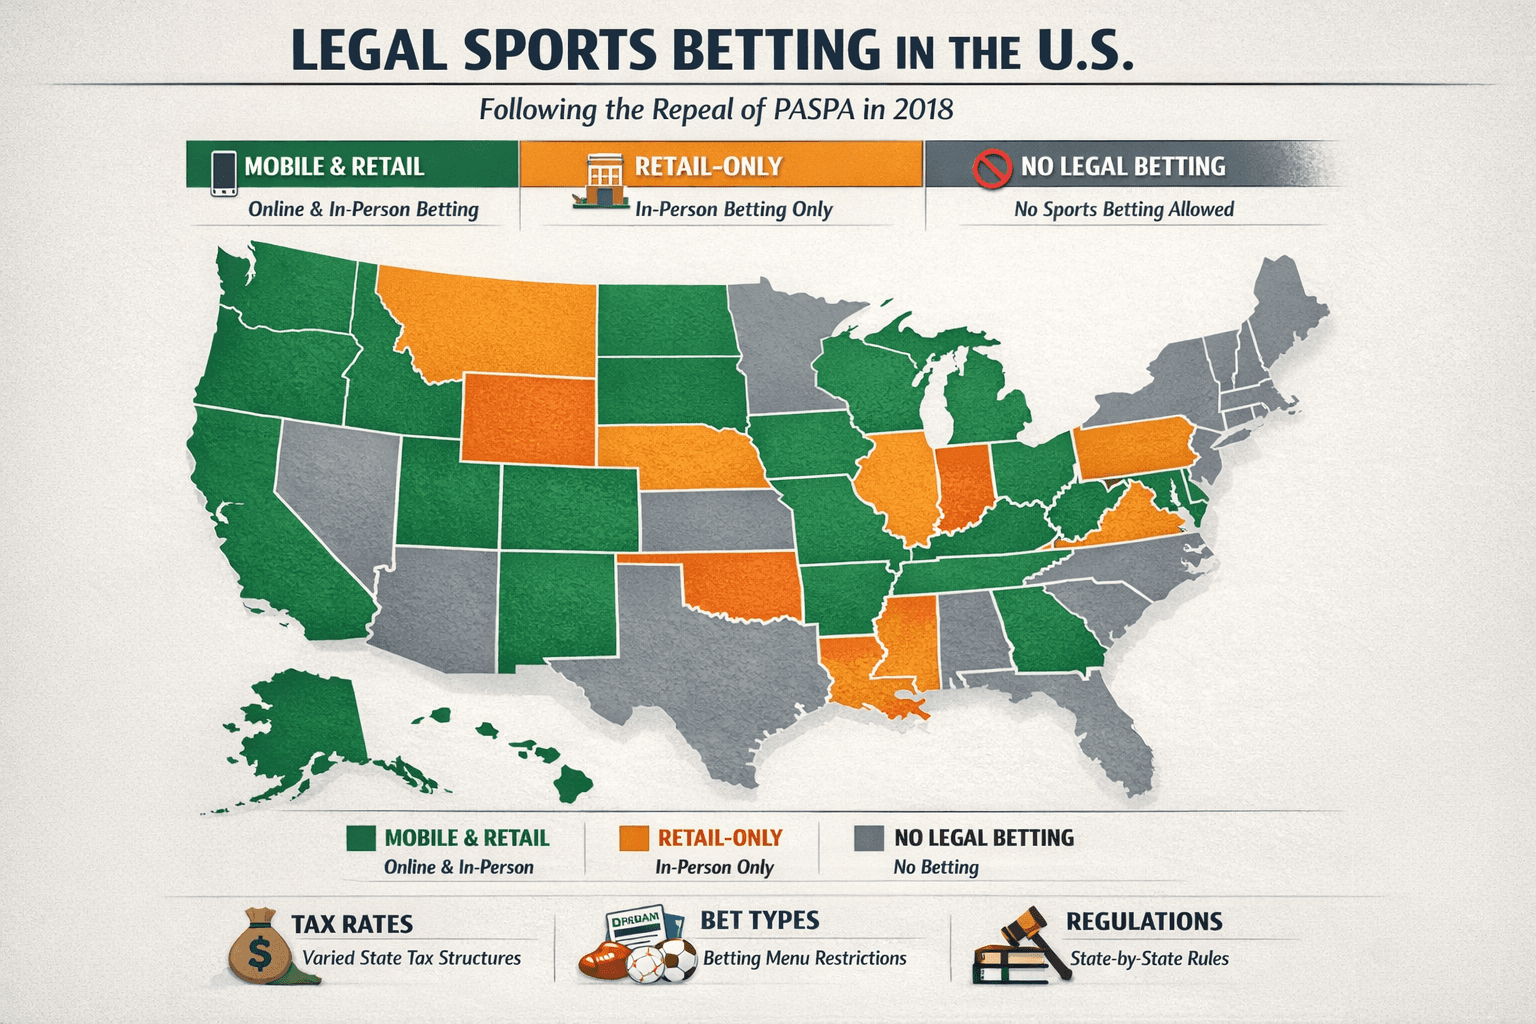
Legal Sports Betting States: 2026 Definitive Sharps Guide
The complete 2026 map of legal US sports betting. Analysis of mobile vs. retail markets, tax impact on odds, prop restrictions, and legislative forecasts.
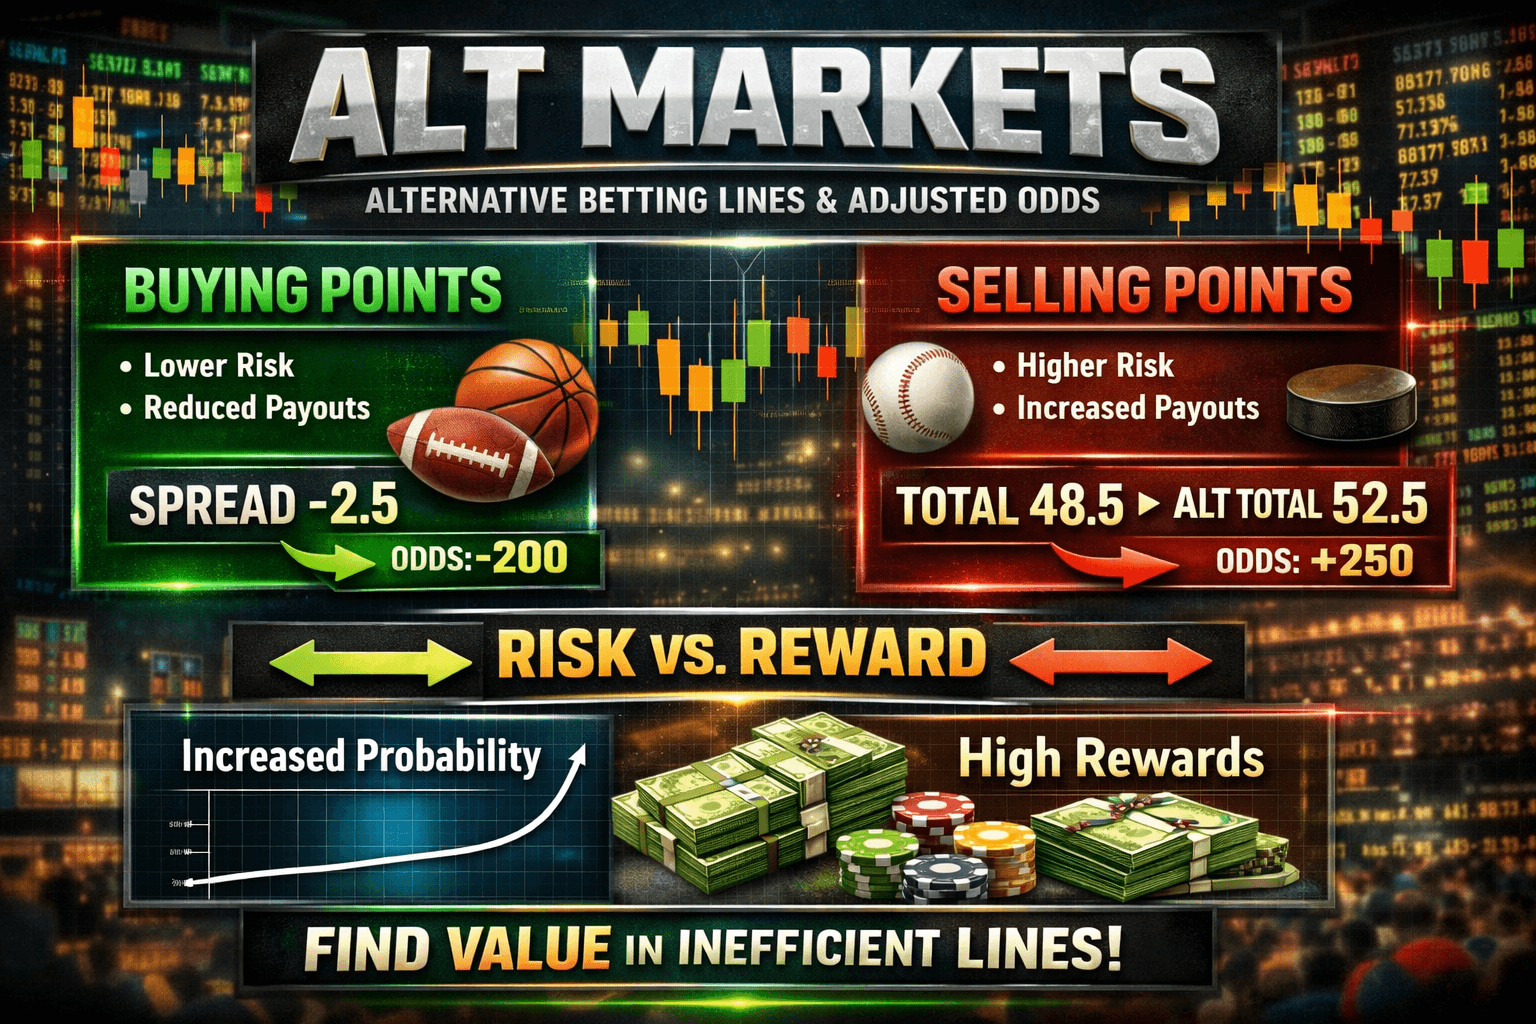
Alt Markets Explained: Exploiting Derivatives for +EV Betting
Master alternate betting markets. Learn how sharps exploit pricing inefficiencies in alt spreads, totals, and props to find edge beyond the main lines.
Ready to find your Edge?
Join thousands of smart bettors who have stopped guessing and started calculating. Access institutional-grade tools for the price of a standard wager.