Betting Splits Explained: The Sharp’s Guide to Money vs. Tickets

Key Takeaways
- The Delta Matters: The raw percentages are less important than the difference between Ticket % (public sentiment) and Money % (sharp conviction).
- Reverse Line Movement (RLM): The strongest signal in betting splits is when the line moves in the opposite direction of the majority of tickets, indicating bookmaker respect for sharp action.
- Market Liquidity: Splits carry different weight depending on the time of week; NFL splits on a Tuesday are noise, while Sunday morning splits represent true market liability.
- The House Position: Sportsbooks do not always balance their books; they often hold lines static against heavy public betting (Ticket %) to gamble on the 'sharp' side.
- Source Verification: Not all data is equal; differentiate between retail splits (DraftKings/FanDuel) which show public bias, and market-maker splits (Circa/Pinnacle) which show professional volume.
Definition
Betting splits are statistical data points that breakdown the percentage of total bets (tickets) and the percentage of total money (handle) placed on each side of a wager. They are utilized by bettors to identify discrepancies between public opinion and professional money flow.
Table of Contents
Betting splits are arguably the most misunderstood data point in the sports betting ecosystem. Novice bettors view them as a simple "fade the public" roadmap. Sharps, however, treat splits as a liquidity map—a way to understand market liability, identify professional resistance, and spot Reverse Line Movement (RLM).
To trade sports effectively, you cannot simply look at a 70% public consensus and bet the other side. You must understand the relationship between the number of bets (Tickets) and the amount of money (Handle/Money). This guide breaks down the mathematics of betting splits, how to interpret the delta between percentages, and how to integrate this data into a broader Positive Expected Value (+EV) strategy.
The Core Components: Tickets vs. Handle#
Before analyzing the data, we must define the two distinct metrics that make up a betting split.
Ticket Percentage (The "Joes")
The Ticket % represents the raw volume of bets placed on a specific side, regardless of the wager size. If 1,000 bets are placed on the Chiefs -3, and 800 of them are on the Chiefs, the Ticket % is 80%.
Ticket count is generally a proxy for public sentiment. The average recreational bettor ("The Joe") bets small amounts ($10–$50). Therefore, a high ticket percentage indicates who the casual fan is rooting for or expects to win. This is heavily influenced by media narratives, recency bias, and star power.
Money Percentage (The "Pros")
The Money % (or Handle %) represents the total currency wagered on a specific side. If $1,000,000 is bet on that same Chiefs game, and $600,000 is on the Chiefs, the Money % is 60%.
The Handle is a proxy for market conviction. Professional bettors ("Sharps") wager significantly larger amounts than the public. When you see a massive discrepancy where the Money % is significantly higher than the Ticket %, it often indicates that high-volume bettors or syndicates have taken a position.
Interpreting the Delta: The Three Scenarios#
The raw numbers mean nothing without context. The value lies in the "Delta"—the difference between the Ticket % and the Money %.
1. The Public/Pro Alignment (No Edge)
- Data: 75% Tickets / 78% Money
- Interpretation: In this scenario, the public and the sharps agree. The favorite is likely a strong team covering a reasonable number, and the sharps don't see value in fading it.
- Strategy: Generally, you want to avoid these games unless your own model shows massive edge. When the bookmaker has liability from both the public and the pros, the line will move swiftly and efficiently. You have likely already missed the best number (CLV).
2. The "Joe" Overload (Fade Opportunity)
- Data: 80% Tickets / 55% Money
- Interpretation: The public is infatuated with a side, but the money isn't backing it up proportionally. While the money is still technically on the popular side (55%), the lack of sharp support suggests the line might be inflated (e.g., the Chiefs are -7 when they should be -6).
- Strategy: This is the classic "fade the public" setup, but it requires caution. You are looking for the book to adjust the line to attract money on the underdog.
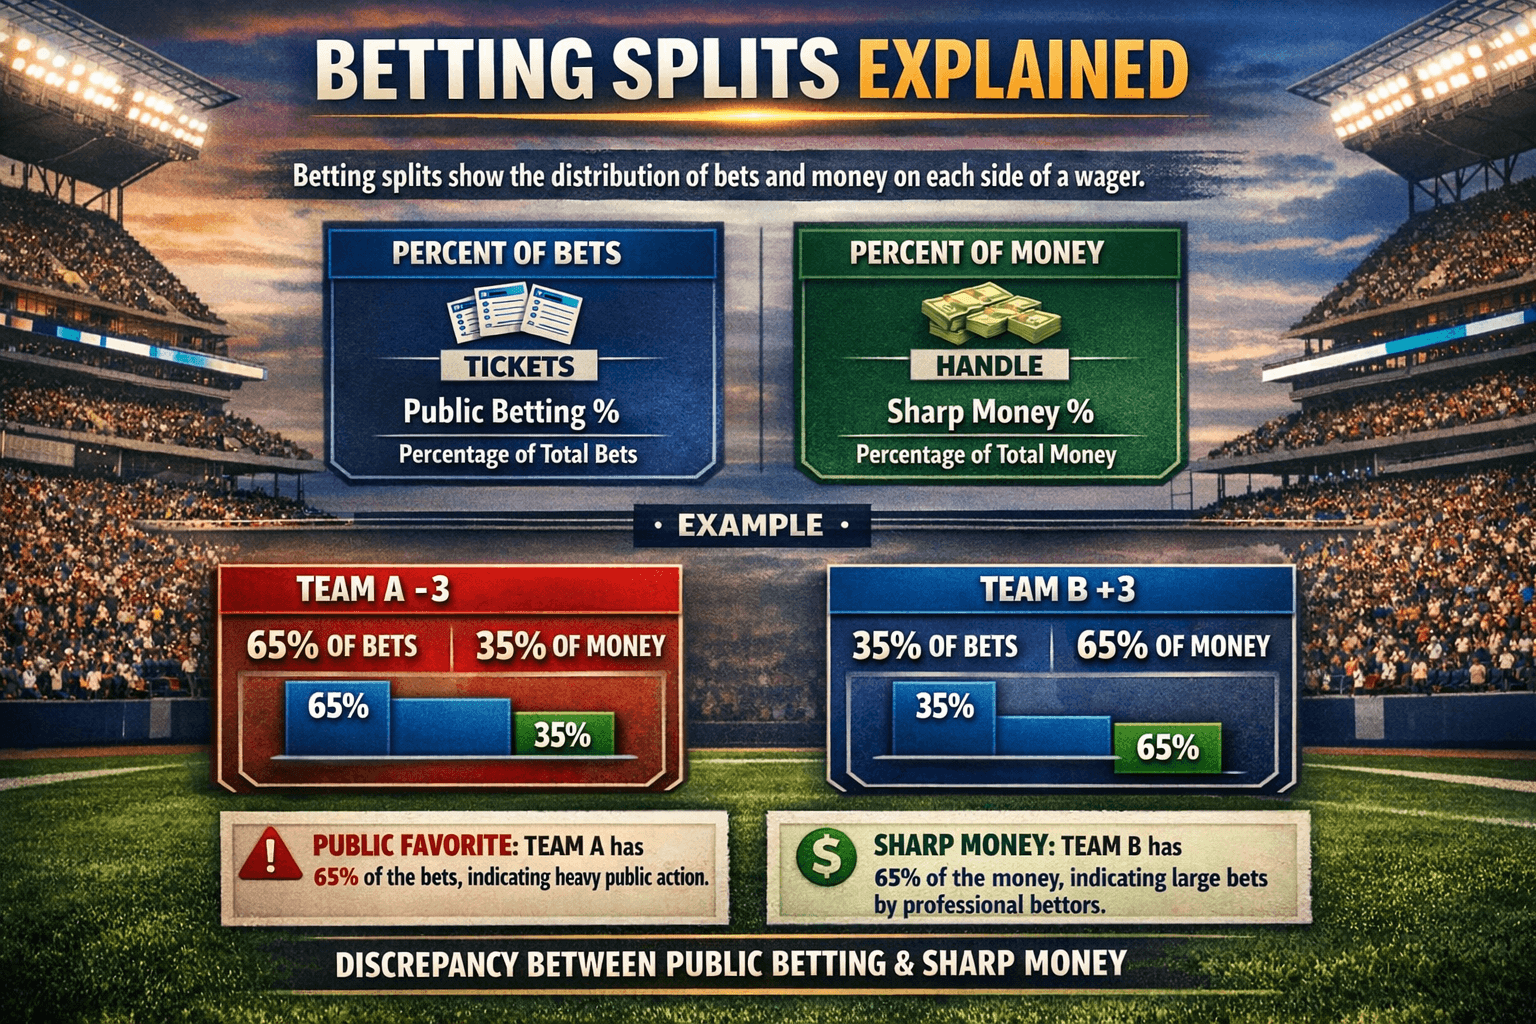
3. The Sharp Split (High Value)
- Data: 35% Tickets / 65% Money
- Interpretation: This is the holy grail of betting splits. The vast majority of bettors are on Team A, yet the majority of the actual cash is on Team B. This implies that a few large wagers (pros) have come in on the unpopular side.
- Strategy: This indicates "Sharp Action." Identify why the pros like the unpopular side. Is there an injury? Is the line mathematically wrong? This is a strong signal to investigate the underdog or the under.
Reverse Line Movement (RLM)#
Betting splits are the primary tool for identifying Reverse Line Movement, one of the strongest indicators of sharp action.
Standard logic dictates that if a team receives 80% of the bets, the sportsbook should adjust the odds to make that team less attractive (e.g., moving from -3 to -3.5) to balance their book.
RLM occurs when the line moves in the OPPOSITE direction of the betting percentages.
Example of RLM
- Opening Line: Dallas Cowboys -4 vs. NY Giants.
- Splits: Cowboys have 75% of Tickets and 80% of the Money.
- Movement: The line drops from Cowboys -4 to Cowboys -3.
Analysis: Why would the sportsbook make it easier for the public to win by lowering the spread when they are already heavily exposed on Dallas? Answer: The sportsbook respects a specific group of bettors who bet on the Giants +4. Even though the total money is on Dallas, the smart money (limit bettors, originating groups) hit the Giants. The bookmaker fears the sharp money more than the public volume.
The Source of Truth: Not All Splits Are Equal#
A critical mistake intermediate bettors make is relying on "Consensus Data" from untrusted sources. To use splits effectively, you must understand the source of the data.
Retail vs. Offshore Splits
- Retail Books (DraftKings/FanDuel/MGM): These splits reflect the general American public. They are heavy on recreational bias, "homer" betting, and parlay liability. They are excellent for gauging public sentiment.
- Offshore/Market Maker Books (Circa/Bookmaker/Pinnacle): Splits from these sources are rarer but infinitely more valuable. These books accept higher limits and ban fewer winners. If you see a money split favor an underdog at a market-maker book, it is a significant signal.
Liquidity and Timing
Splits are dynamic. A 90% money split on a Tuesday for an NFL Sunday game is meaningless because the market has low liquidity—$500 could swing the percentage.
- Early Week: ignore splits; focus on openers.
- Mid Week: Splits begin to form narratives.
- Game Day: This is when splits matter. The limits are highest, and the true sharp money enters the market.
Limits, Liability, and The "House"#
To truly understand splits, you must think like a risk manager. Sportsbooks do not always aim to "balance the book" to make a risk-free vigorish (vig). That is a myth.
Sportsbooks often take a position. If the public is pounding a heavy favorite, the book will often hold the line, effectively gambling against the public.
When analyzing splits, look for Market Hold. If a book is refusing to move a line despite lopsided splits, they are taking a stand.
- The "Line in the Sand": If the public is on the Over 55.5 (90% tickets), and the book refuses to move to 56, the book is comfortable needing the Under.
Integrating Splits into a +EV Workflow#
Betting splits should rarely be the sole reason for a wager. They are a confirmation signal or a flag to start research. Here is how to use them within a modern workflow:
- Identify the Split: Use your data feed to find games with <40% Tickets but >60% Money.
- Check the Line Movement: Has the line moved toward the money? (RLM).
- Shop for the Best Number: If the sharps like the Bears +3.5, but the line has already moved to +3 at sharp books, check recreational books. They often lag behind.
- Pro Tip: Use a Line Shopper to find books that haven't adjusted to the sharp action yet. The split tells you what to bet; the Line Shopper tells you where to bet.
- Verify with Origination: Check if the move correlates with a player prop injury or weather report.
- Execution: Bet the side aligned with the money handle, ensuring you are beating the Closing Line Value (CLV).
Sport-Specific Nuances#
NFL Splits
The most efficient market. Public money is massive here. "Fading the public" works less well in the NFL than in other sports because the volume is so high that lines are extremely sharp. Focus heavily on RLM here. If a line moves through a key number (3 or 7) against the percentages, pay attention.
NBA Splits
Driven by late news. Splits in the NBA are volatile. A 80% money split on the Lakers might flip instantly if LeBron is ruled out 30 minutes before tip. Only trust NBA splits closer to tip-off once lineups are confirmed.
MLB Splits
The highest volume of daily games. Public bettors hate betting on bad teams, even if they have a pitching advantage. You will frequently see massive ticket counts on favorites (Yankees, Dodgers). MLB splits are excellent for finding value on ugly underdogs that the public refuses to touch.
Common Pitfalls (The "Fake Sharp" Traps)#
1. The Phantom Money
Sometimes, "Money %" is reported by affiliates who only track a small subset of sportsbooks. If a data provider says "90% Money is on the Jets," ask yourself: 90% of what? If it's 90% of a small pool of users, the data is noise.
2. Chasing the Steam
If you see a split that indicates sharp money, and the line has already moved 2 points, you are too late. The value is gone. Betting the "sharp side" at a bad number is a losing strategy.
3. Ignoring the "Buyback"
Sharps are not a monolith. One group may bet the Opener, pushing the line up. Another sharp group may see value in the new inflated number and hit the "buyback." Just because the money split favors one side initially doesn't mean it stays there.
Conclusion#
Betting splits are the dashboard of the market. They tell you who is driving the car (the public) and who is fueling the tank (the pros). By learning to read the disparity between Ticket % and Handle %, identifying Reverse Line Movement, and understanding the liability of the sportsbook, you move from guessing to analyzing.
However, data without execution is useless. Once you identify a split that suggests a market inefficiency, you must execute at the best possible odds. Utilizing tools like an Arbitrage Finder or Live +EV Feed ensures that when you follow the money, you are doing so with a mathematical advantage.
Frequently Asked Questions
What is the difference between betting handle and ticket count?▼
What is a good betting split to look for?▼
Does fading the public always work?▼
Why do sportsbooks move lines against the public percentages?▼
Where can I find the most accurate betting splits?▼
Related Articles
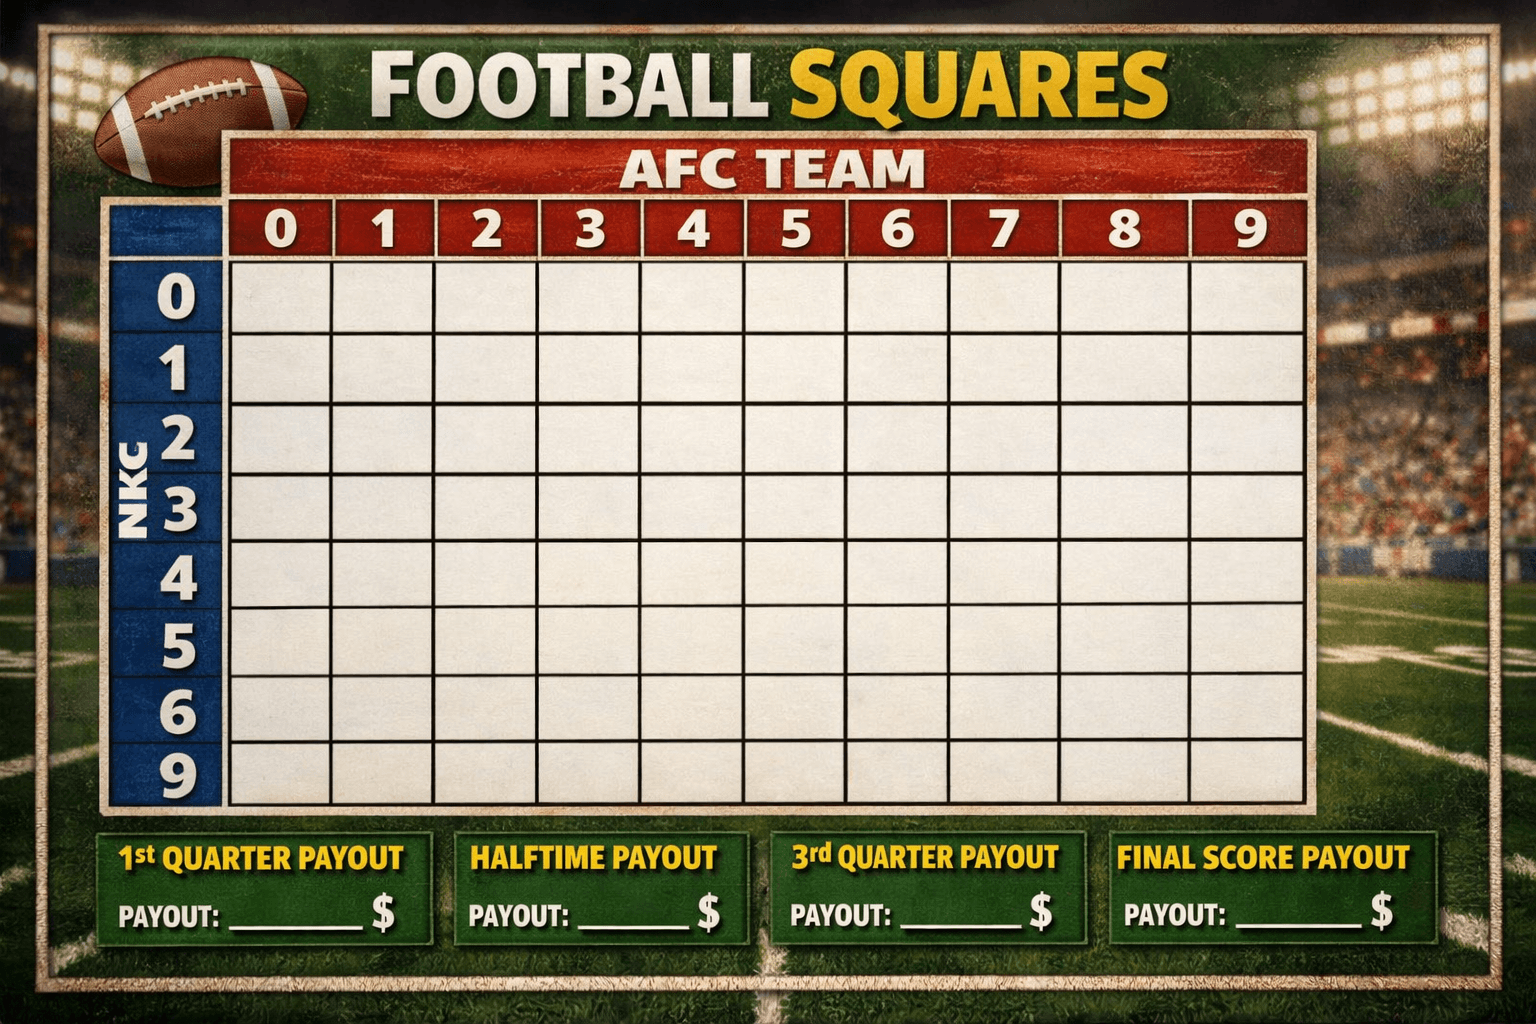
Football Squares Rules: The Definitive Analytics & Strategy Guide
Master football squares with this data-driven guide. Learn the rules, optimal number probabilities, auction valuation strategies, and how to gain an edge in high-stakes pools.
.png&w=3840&q=75)
Middling in Sports Betting: The Math Behind the Most Profitable Play
Master the art of middling. Learn how to exploit line movements to create risk-free windows where you win both sides of a bet. Advanced strategy for sharps.
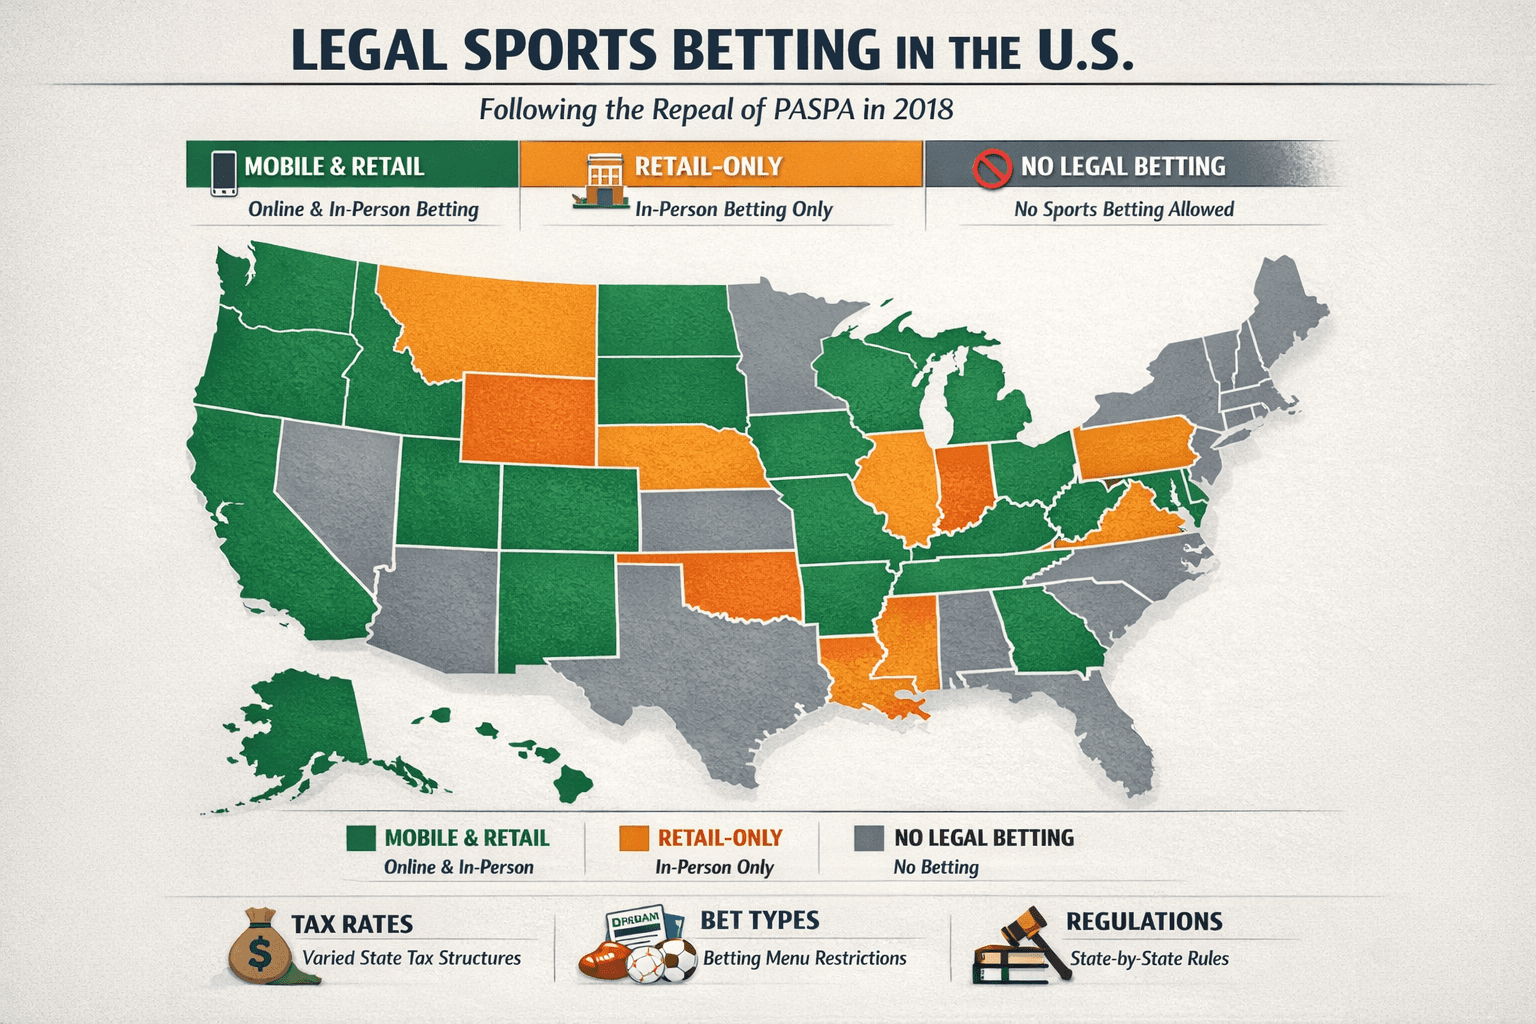
Legal Sports Betting States: 2026 Definitive Sharps Guide
The complete 2026 map of legal US sports betting. Analysis of mobile vs. retail markets, tax impact on odds, prop restrictions, and legislative forecasts.
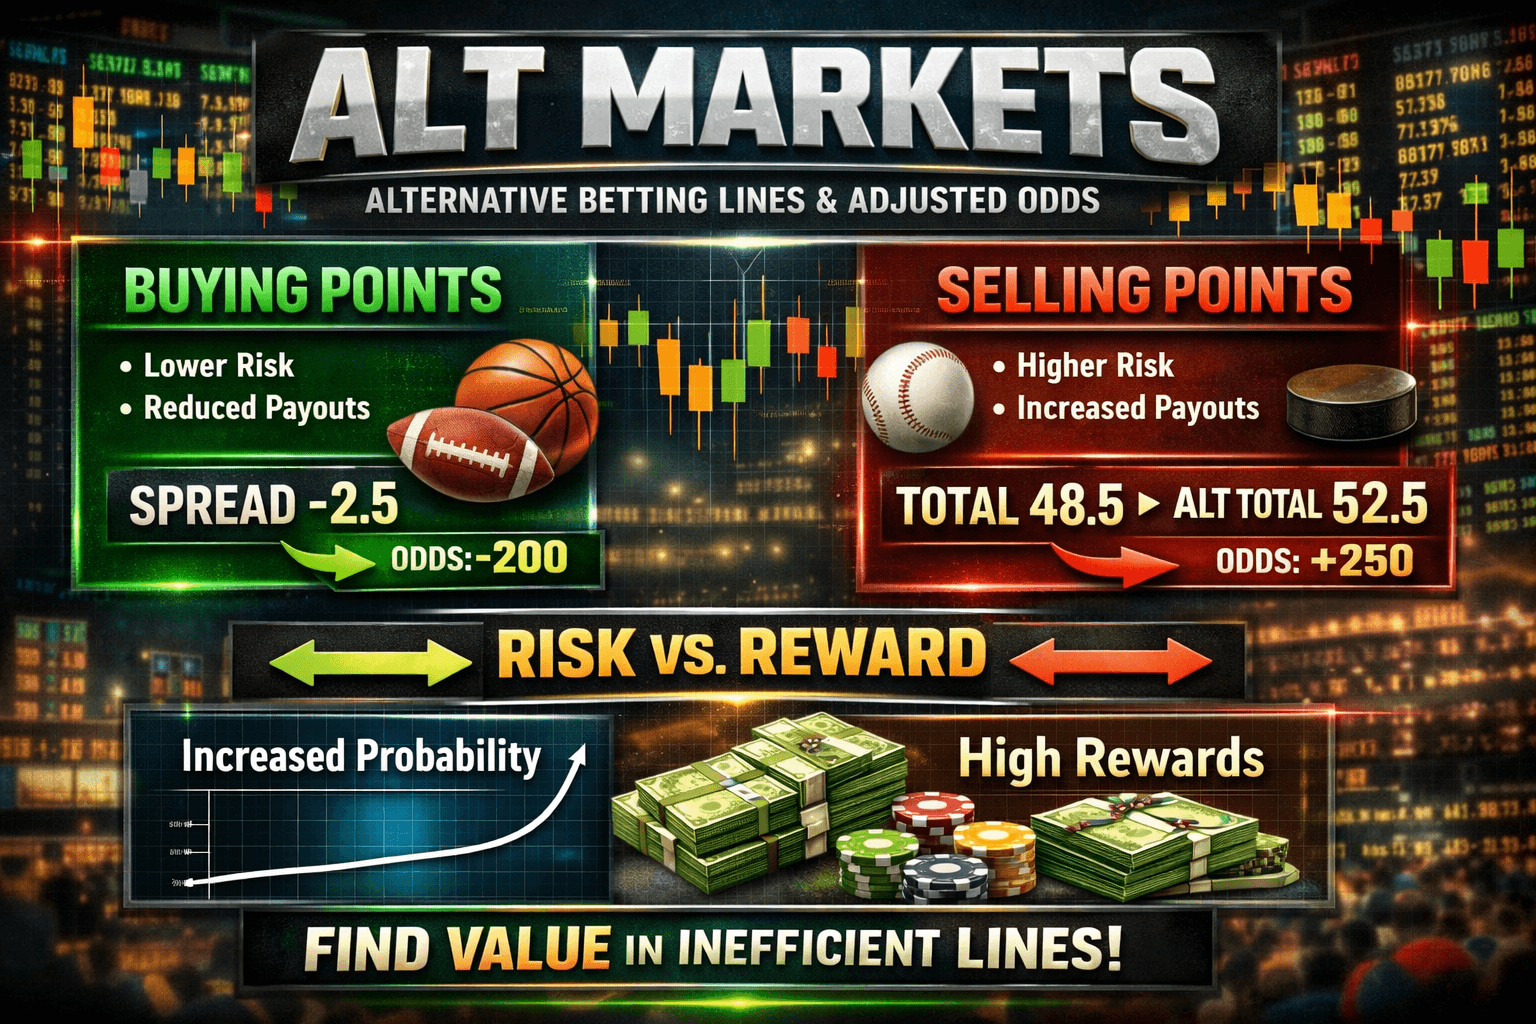
Alt Markets Explained: Exploiting Derivatives for +EV Betting
Master alternate betting markets. Learn how sharps exploit pricing inefficiencies in alt spreads, totals, and props to find edge beyond the main lines.
Ready to find your Edge?
Join thousands of smart bettors who have stopped guessing and started calculating. Access institutional-grade tools for the price of a standard wager.