How to Build a Sports Betting Model: The Definitive Guide

Key Takeaways
- Price Discovery, Not Prediction: The goal of a model is not to predict the winner, but to calculate a 'true probability' that is more accurate than the sportsbook's implied probability.
- Feature Engineering is Key: Raw statistics are rarely predictive. Success comes from transforming data into rolling averages, opponent-adjusted metrics, and efficiency ratings.
- Avoid Look-Ahead Bias: The most critical technical error is using data in your training set that would not have been available at the time of the game (e.g., using season-long averages to predict Week 1).
- Metric Selection: Accuracy (%) is a vanity metric. Professional modelers use Log Loss and ROI (Return on Investment) to evaluate performance.
- Execution Matters: Even a great model will fail without proper bankroll management (Kelly Criterion) and line shopping to ensure you are betting into the best available number.
Definition
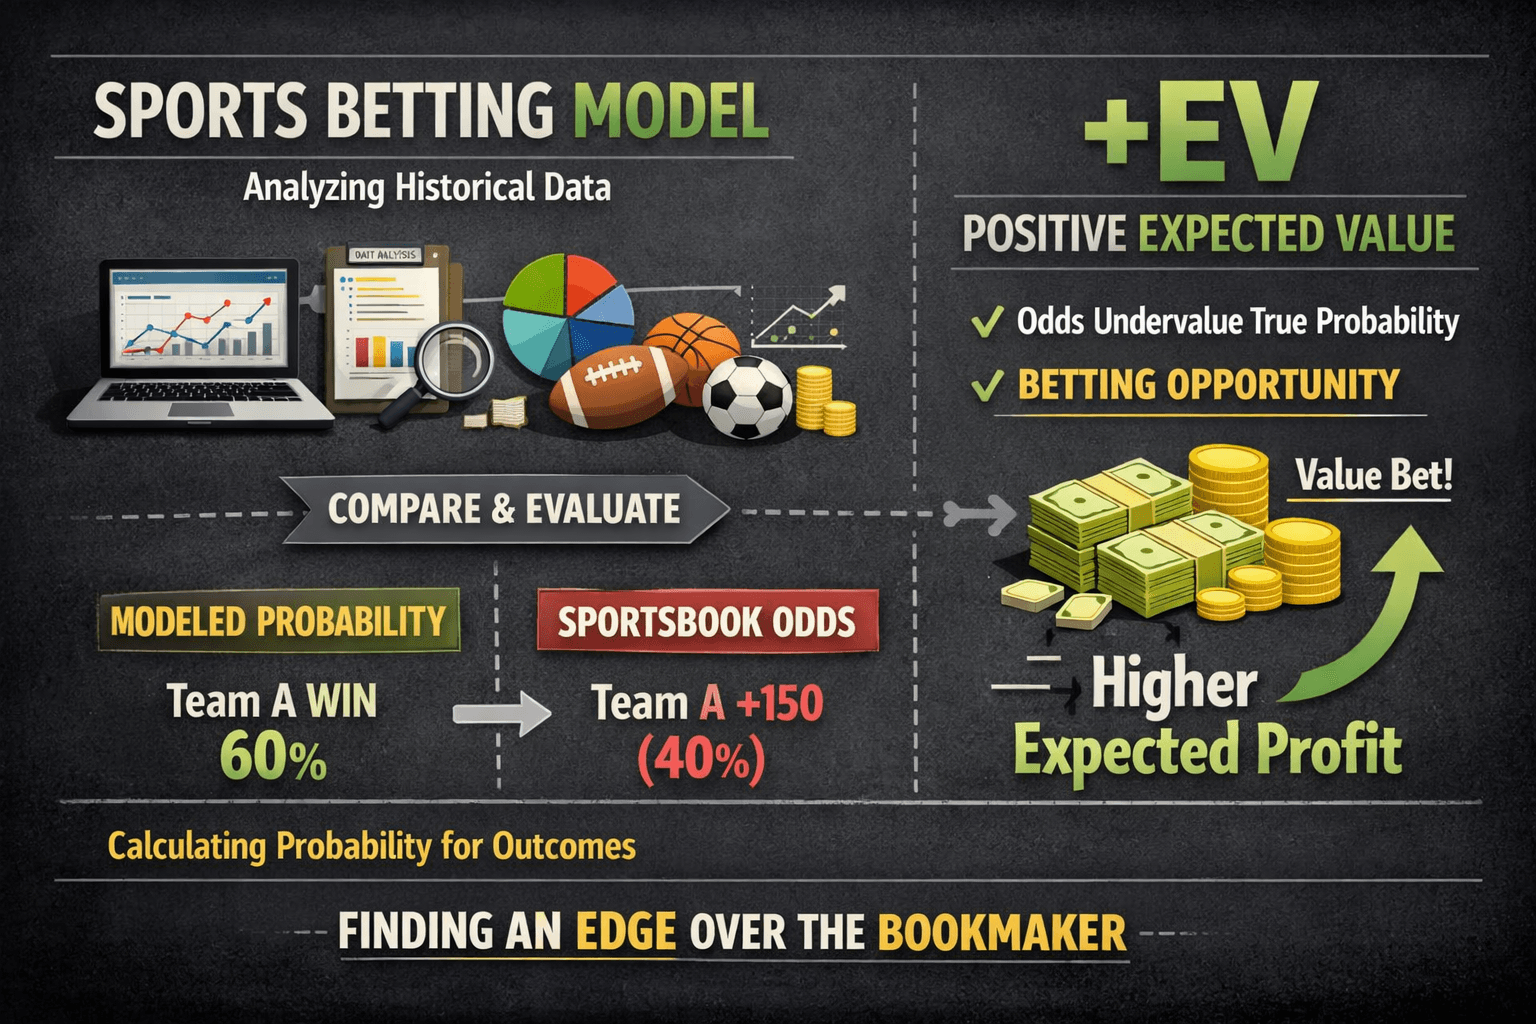
A sports betting model is a quantitative system that processes historical data to assign probabilities to future sporting events. By comparing these modeled probabilities against sportsbook odds, bettors can identify "positive expected value" (+EV)—situations where the bookmaker's price underestimates the true likelihood of an outcome.
Table of Contents
Building a sports betting model is the closest a bettor can get to printing their own odds. It is the transition from "handicapping"—relying on intuition and trends—to "quant trading"—relying on math, logic, and large datasets.
For the sophisticated bettor, a model is not a crystal ball that predicts the future; it is a price discovery tool. The goal is not to determine who will win, but what probability they have of winning. If your model calculates that the Chiefs have a 60% chance of winning, but the implied probability of the sportsbook’s odds is only 55%, you have an edge.
This guide covers the end-to-end architecture of a professional-grade betting model, from data ingestion to backtesting.
The Philosophy: Top-Down vs. Bottom-Up#
Before writing a single line of Python, you must decide on your modeling philosophy.
Top-Down (Market-Based) Models: These models assume the betting market is generally efficient. They use the odds themselves as the primary input. A top-down model might look at the opening line, the movement of limits, and the Closing Line Value (CLV) to reverse-engineer the "sharp" money.
Bottom-Up (Fundamental) Models: These models ignore the odds initially. They build a view of the game based on granular data—player stats, weather, injuries, play-by-play data, and tactical matchups. This guide focuses primarily on Bottom-Up modeling, as it is the only way to originate true raw prices.
Step 1: Defining the Target Variable#
A common mistake is trying to model "the game." You must model a specific variable.
- Binary Classification: Will Team A win? (1 or 0). Used for Moneyline betting.
- Regression: How many points will be scored? (Continuous variable). Used for Totals and Spreads.
- Player Props: How many rebounds will Player X get? (Poisson distribution).
For this guide, we will assume we are building a Binary Classification model for the NFL Moneyline (Win/Loss).
Step 2: Data Acquisition#
Garbage in, garbage out. The quality of your data dictates the ceiling of your model. You need two distinct datasets: Historical Game Data (stats) and Historical Odds Data (prices).
Sources
- APIs: reliable paid sources like Sportradar or free/freemium options like The-Odds-API.
- Scrapers: Using Python libraries (
BeautifulSouporSelenium) to scrape sites like Pro-Football-Reference. - Databases: Open-source repositories like Retrosheet (MLB) or nflfastR (NFL).
The Data Frame
Your initial dataset should be structured with one row per game. Essential columns include:
- Date
- Home Team / Away Team
- Home Score / Away Score
- Key Metrics (Yards per play, Turnovers, EPA/Play, etc.)
Step 3: Feature Engineering#
This is where the "alpha" is created. Raw stats are rarely predictive on their own. You must transform them into "features" that have a correlation with the target variable.
1. Rolling Averages
You cannot use the stats from the current game to predict the current game (that is data leakage). You must use past performance to predict future performance.
Create rolling averages (e.g., Last 5 Games, Season-to-Date) for metrics like Offensive Efficiency or Pace.
- Exponential Moving Average (EMA): Weight recent games more heavily than games from two months ago.
2. Opponent Adjustment
A team gaining 400 yards against the best defense in the league is more impressive than gaining 400 yards against the worst. You must normalize stats based on the strength of the opponent.
3. Elo Ratings
An Elo system updates a team's strength rating after every game based on the quality of the opponent and the margin of victory. This provides a single number that encapsulates "team strength."
4. Situational Variables
- Rest Days: Is the team on a back-to-back?
- Travel: Distance traveled or time zone changes.
- Home Field Advantage: Historically significant, though shrinking in modern sports.
Step 4: Selecting the Algorithm#
Once you have your features (X) and your target (Y), you need an algorithm to learn the relationship between them.
Logistic Regression
The industry standard for binary outcomes (Win/Loss). It outputs a probability between 0 and 1. It is interpretable and efficient. If you are modeling spreads (points), you would use Linear Regression.
Random Forest / XGBoost
Tree-based models are powerful because they can capture non-linear relationships (e.g., wind speed only matters if it's above 15mph). However, they are prone to overfitting if not carefully tuned.
Poisson Distribution
Ideal for low-scoring sports like Soccer or Hockey. It models the count of events (goals) occurring within a fixed time.
Step 5: The Cardinal Sin (Look-Ahead Bias)#
The most common reason models fail is Look-Ahead Bias. This occurs when your model inadvertently uses information that wasn't available at the time the game started.
- Example: Using "Season Long Average EPA" to predict a Week 4 game. The season-long average includes data from Weeks 5-17. You can only use data available prior to kickoff.
The Solution: Strictly separate your data chronologically. Train on 2018-2022. Test on 2023. Never mix them.
Step 6: Evaluation Metrics#
Do not judge your model by "Win %." In sports betting, a model with 55% accuracy on -110 odds is profitable, while a model with 80% accuracy on -500 odds is a disaster.
Use these metrics instead:
- Log Loss (Cross-Entropy Loss): Measures how confident your model was in its correct predictions and how efficiently it punished wrong ones. Lower is better.
- Brier Score: The mean squared difference between the predicted probability and the actual outcome.
- ROI (Return on Investment): The ultimate metric. If you bet every edge your model identified, would you have made money?
Step 7: Execution and The Kelly Criterion#
Your model outputs a probability (e.g., 58%). The sportsbook offers odds of -110 (52.4% implied probability). You have a 5.6% edge. How much do you bet?
Using a flat bet size (e.g., $100 on every game) is suboptimal. You should scale your bet size based on the size of the edge.
The Kelly Criterion helps calculate the optimal stake to maximize bankroll growth while minimizing the risk of ruin.
- is the fraction of the bankroll to wager.
- is the decimal odds - 1.
- is the probability of winning (per your model).
- is the probability of losing ($1-p$).
Note: Most pros use a "Fractional Kelly" (e.g., Quarter Kelly) to reduce variance.
Step 8: Benchmarking Against the Market#
Once your model is live, you need to validate it against the sharpest bookmakers.
Use a Line Shopper to compare your Originated Price against the market consensus.
- If your model says the line should be -150, and the market is -110, you theoretically have a massive edge.
- However, if the market moves to -160 before kickoff (CLV), your model was likely correct.
- If the market stays at -110 or moves to +100, your model is likely missing information (injury news, tactical change) that the market knows.
Advanced: Hybrid Approaches#
The best models today are hybrids. They take a fundamental output (stats-based) and blend it with market signals.
For example, if the betting limits on a game increase significantly, it signals confidence from the market makers. You might weight your model's influence lower in high-liquidity markets (NFL Super Bowl) and higher in low-liquidity markets (NCAA prop bets) where the bookmakers spend fewer resources sharpening their lines.
Summary#
Building a sports betting model is an iterative process.
- Ingest clean, historical data.
- Engineer features that have predictive power.
- Train an algorithm while avoiding look-ahead bias.
- Test for ROI, not just accuracy.
- Execute using Kelly staking and line shopping.
The goal is not perfection; the goal is to be less wrong than the implied probability of the odds you are betting.
Frequently Asked Questions
What is the best programming language for building a sports betting model?▼
How much data do I need to build a reliable model?▼
What is 'Look-Ahead Bias' in sports modeling?▼
Can I build a profitable betting model in Excel?▼
What is a good ROI for a betting model?▼
Related Articles
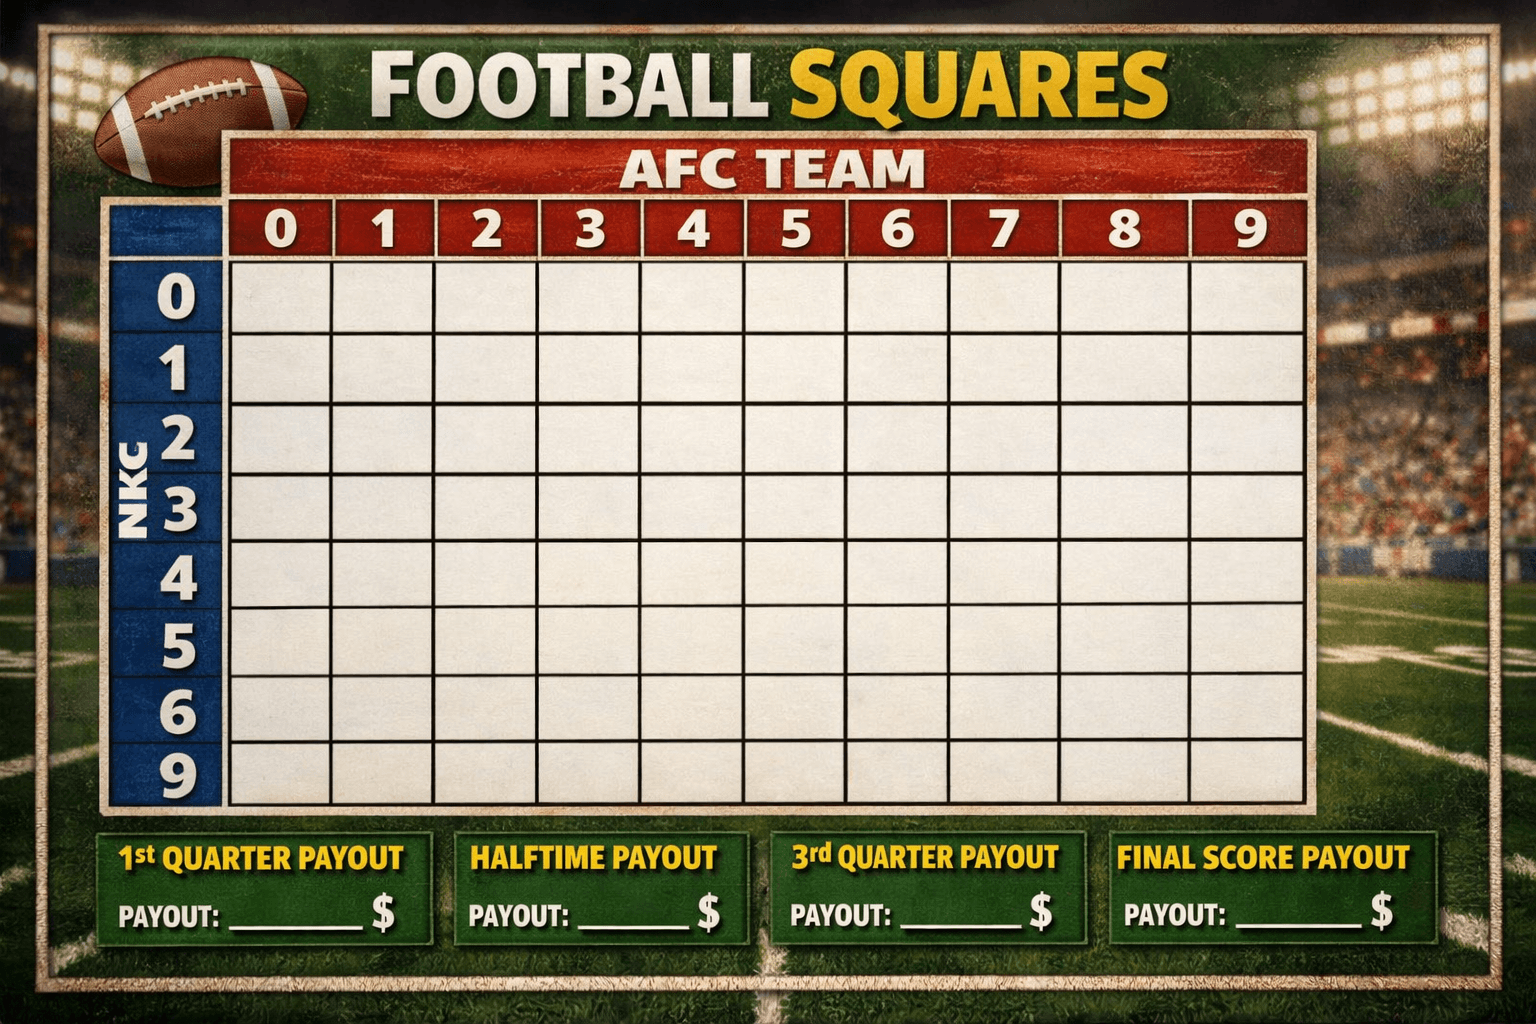
Football Squares Rules: The Definitive Analytics & Strategy Guide
Master football squares with this data-driven guide. Learn the rules, optimal number probabilities, auction valuation strategies, and how to gain an edge in high-stakes pools.
.png&w=3840&q=75)
Middling in Sports Betting: The Math Behind the Most Profitable Play
Master the art of middling. Learn how to exploit line movements to create risk-free windows where you win both sides of a bet. Advanced strategy for sharps.
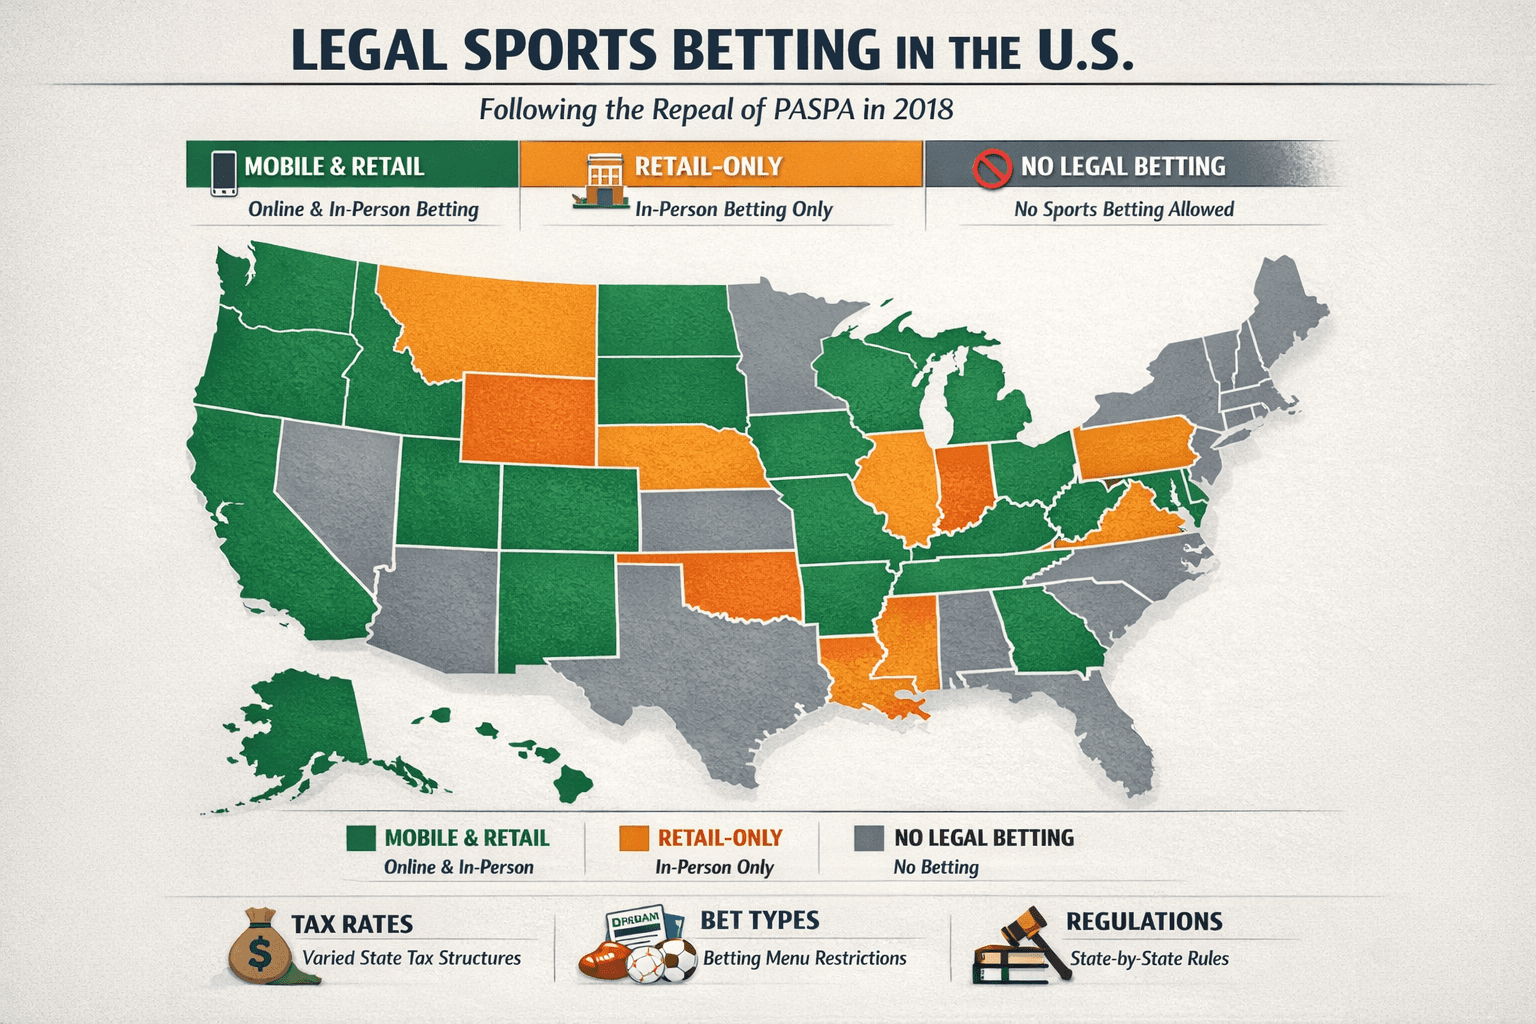
Legal Sports Betting States: 2026 Definitive Sharps Guide
The complete 2026 map of legal US sports betting. Analysis of mobile vs. retail markets, tax impact on odds, prop restrictions, and legislative forecasts.
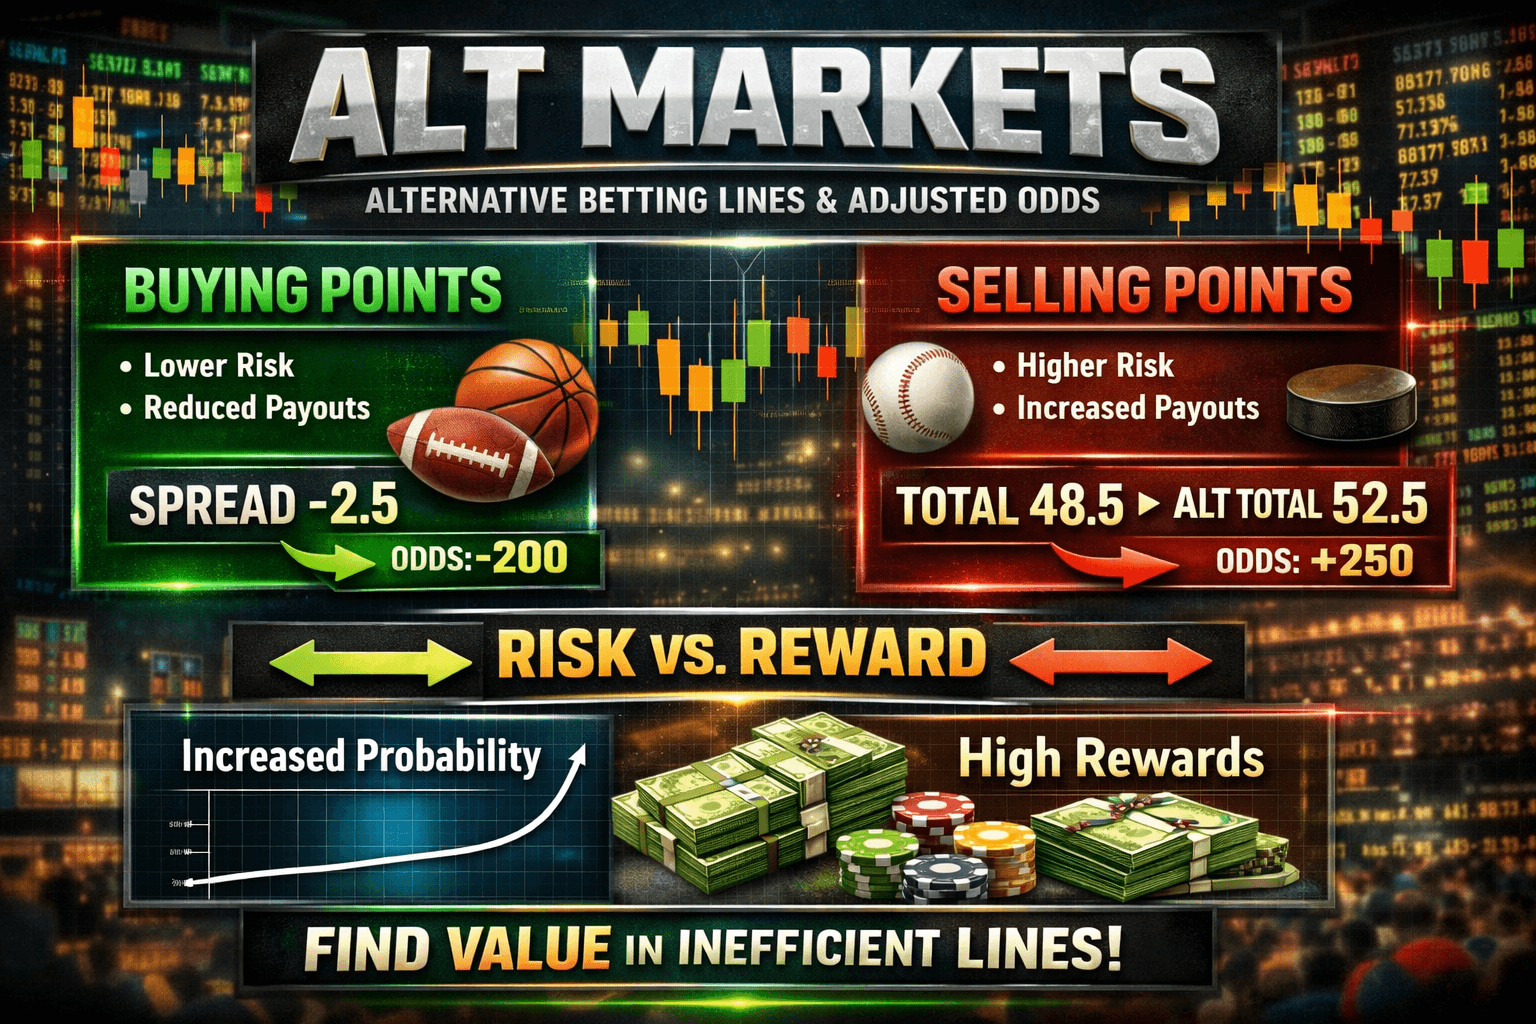
Alt Markets Explained: Exploiting Derivatives for +EV Betting
Master alternate betting markets. Learn how sharps exploit pricing inefficiencies in alt spreads, totals, and props to find edge beyond the main lines.
Ready to find your Edge?
Join thousands of smart bettors who have stopped guessing and started calculating. Access institutional-grade tools for the price of a standard wager.