The Sportsbook Screen: How to Read Markets Like a Pro

Key Takeaways
- The Definition: A sportsbook screen is a real-time dashboard aggregating odds from multiple bookmakers, used to monitor market sentiment and identify pricing inefficiencies.
- Market Hierarchy: To use a screen effectively, you must distinguish between 'Market Maker' books (which set the true price) and 'Retail' books (which usually follow).
- Identifying Steam: A uniform line move across sharp books indicates 'steam' or professional money; tracking this visual wave helps bettors identify the true market direction.
- Top-Down Strategy: The primary utility of a screen is finding 'stale' lines—betting on a number at a slow-moving book that is better than the price established by sharp market makers.
- The Juice Signal: Line movement isn't just about the spread changing numbers; watching the 'vig' or 'juice' increase (e.g., -110 to -125) often predicts an imminent shift in the spread.
Definition
A sportsbook screen is a real-time data visualization tool that aggregates odds, spreads, and totals from multiple bookmakers into a single dashboard. It allows professional bettors to monitor market sentiment, track line movement across the betting ecosystem, and identify pricing inefficiencies between "sharp" market makers and "soft" retail books.
Table of Contents
In the high-frequency trading environment of modern sports betting, information is not just power—it is profit. If you walk into a proprietary trading firm on Wall Street, you will see rows of Bloomberg Terminals. If you walk into a syndicate betting office in Las Vegas or a sharp's home setup, you will see "The Screen."
For the aspiring professional bettor, moving from checking individual sportsbook apps to utilizing a comprehensive sportsbook screen is the graduation from recreational gambling to market speculation. It is the cockpit from which you surveil the entire betting ecosystem.
But owning a screen is not enough. You must know how to interpret the cascading wall of numbers, recognize the hierarchy of influence among bookmakers, and execute on the information before the market corrects itself.
The Architecture of the Screen#
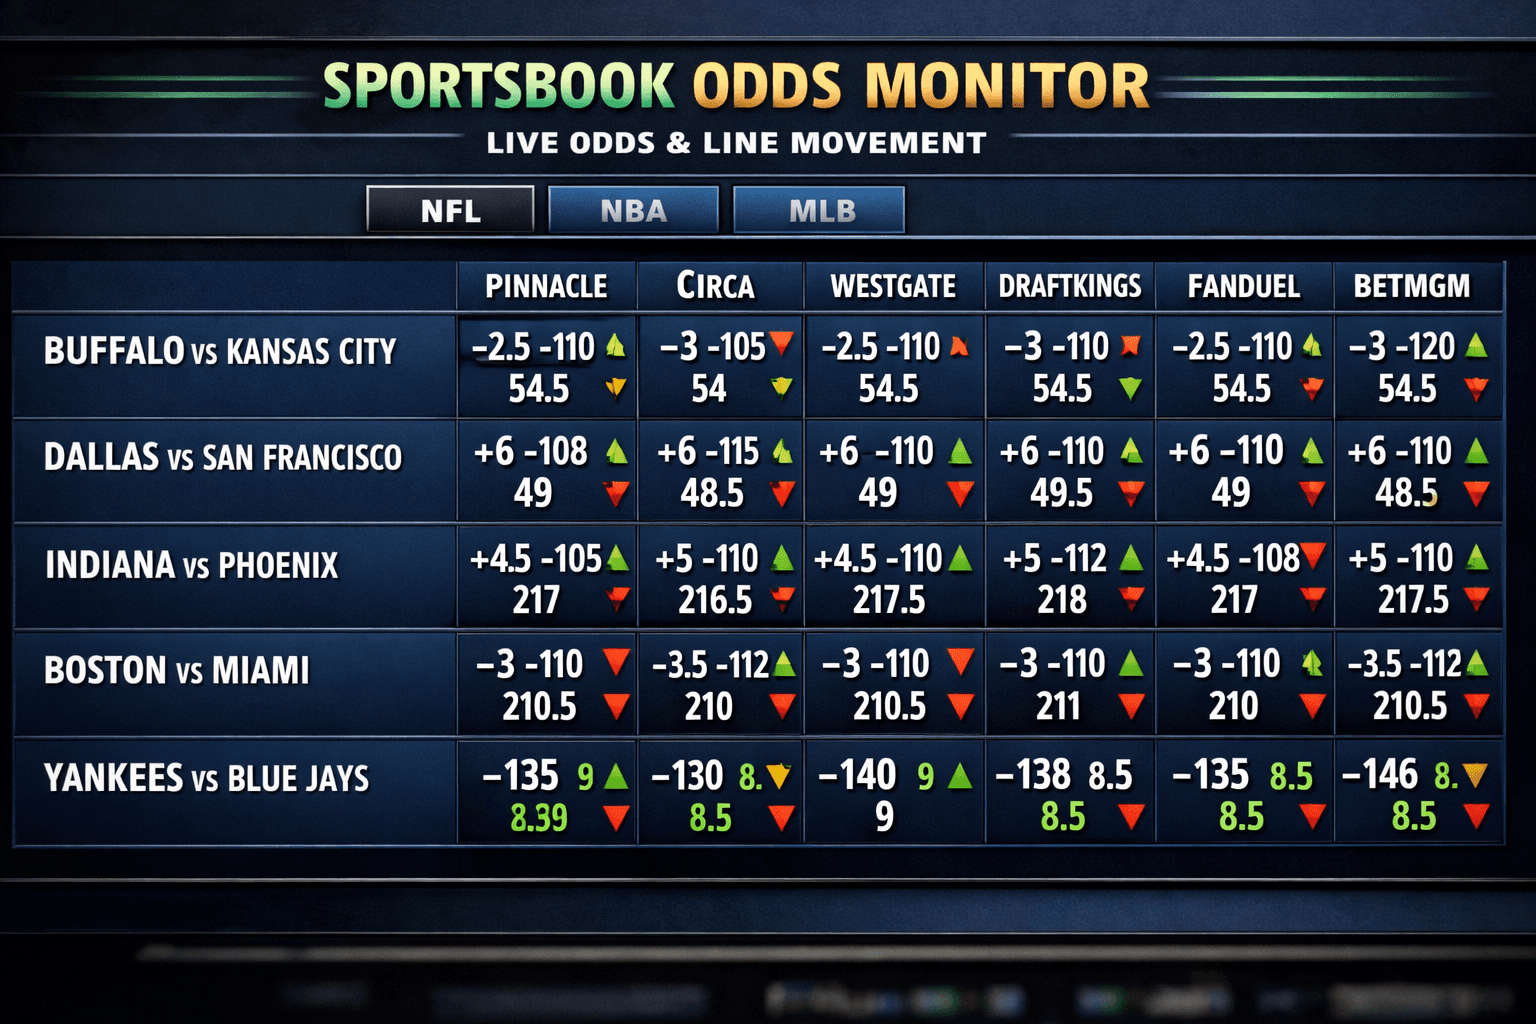
At its core, a sportsbook screen is an aggregator. It pulls API feeds from dozens of sportsbooks—ranging from market-making offshores to regulated US retail books—and organizes them into a grid.
Typically, the vertical axis lists the games (identified by "Rotation Numbers" or "Rot Numbers"), and the horizontal axis lists the sportsbooks. The cells contain the current spread, moneyline, and total.
The Hierarchy of Books
Not all columns on your screen are created equal. To read the market effectively, you must mentally categorize the books on your display into three tiers:
- The Originators (Market Makers): These are the books that accept the highest limits and welcome sharp action. They move the line based on liability. When a book like Pinnacle or Circa Sports moves, the rest of the screen will usually follow within seconds or minutes. These are your "source of truth."
- The Copiers (Retail/Soft Books): Major US regulated books often shade their lines based on public perception but generally draft off the market makers. They will adjust their lines not necessarily because they took a big bet, but because they saw the Market Makers move.
- The Laggards: These are books with slower update frequencies or manual trading teams. They are often the target of "steam chasing" or "top-down" betting strategies because they leave "stale" numbers hanging after the rest of the market has shifted.
Reading the Tape: Interpreting Line Movement#
The primary function of the screen is to visualize the flow of money. Most screens use color-coding to indicate recent changes—often flashing green for an opening of the line (odds getting longer) and red for a tightening (odds getting shorter).
Identifying Steam
"Steam" refers to a sudden, uniform line move across the entire marketplace, usually precipitated by a syndicate or whale group max-betting a number at a sharp book.
On your screen, steam looks like a wave. You might see the limit-heavy offshore books adjust their spread from -3.5 to -4.0. Milliseconds later, the agile retail books follow. Finally, the slow-moving credit shops or smaller apps update.
The visual pattern of steam is critical. If only one book moves, it might be a position-specific liability adjustment. If the entire "sharp" side of the screen moves in unison, it is a market signal.
The Head Fake
Sophisticated groups know that the entire industry is watching the screen. Occasionally, you will witness a "head fake." A group might pound a line in one direction at a highly visible book to trigger an automated market reaction, only to bet significantly more on the other side at other books once the price has drifted to a more favorable number.
Detecting a head fake requires understanding the liquidity of the market. A move on a Tuesday morning for an NFL Sunday game is less likely to be genuine steam than a move 15 minutes before kickoff, simply because limits are lower and the market is less liquid early in the week.
Top-Down Betting Strategy#
The most common strategy associated with screen usage is "Top-Down" betting. This methodology assumes that the sharpest books (the Market Makers) have the "correct" probability.
If the sharpest book on your screen has the Chiefs at -7 (-110), and you scan the grid to find a recreational book still offering the Chiefs at -6.5 (-110), you have identified a discrepancy. You are effectively buying a stock for $6.50 that the wider market values at $7.00.
The Role of Latency
In the past, bettors could rely on manual refreshing. Today, the war is fought on latency. High-end screens refresh via websockets, pushing data updates in milliseconds. If your screen has a 30-second delay, you are looking at a historical artifact, not a live market.
However, even with the fastest eyes, manual execution is difficult. This is where automated tools bridge the gap. While a screen gives you the macro view, tools like the Live +EV Feed automate the "stare and compare" process, instantly calculating the mathematical edge between the market consensus and rogue lines, alerting you to opportunities that the human eye might miss in the sea of data.
Advanced Screen Dynamics#
Rotation Numbers and Correlation
Pros use Rotation Numbers to quickly identify games, but they also use them to spot correlated parlays on the screen. If you see the spread on the first half of a game move significantly, your eyes should immediately dart to the full-game spread and the second-half derivatives. The screen allows you to see these correlated pricing adjustments in real-time.
The "Painted" Screen
A "painted" screen occurs when every single bookmaker has settled on the exact same number and price (e.g., everyone is -3 -110). This indicates a highly efficient, liquid market where no edge currently exists on the spread. In these scenarios, value hunters must pivot to props or derivative markets, or wait for breaking news (injuries, weather) to disrupt the equilibrium.
Spotting "Off-Screen" Money
Sometimes the screen doesn't move, but the price (juice) does. If a line stays at -3, but the vigorous moved from -110 to -115, to -120, and then to -125, the screen is telling you that pressure is building. The dam is about to break. This is often the precursor to a move to -3.5.
A novice bettor waits for the -3.5 to appear. A sharp bettor reading the screen sees the juice boiling at -125 and grabs the -3 before it disappears.
The Evolution of the Screen#
Historically, screens were static grids. The modern sportsbook screen is dynamic. It integrates consensus data, injury reports, and even arbitrage indicators directly into the cell.
We are also seeing the rise of "synthetic" lines on screens. This is where the software calculates the "Fair Value" or "No-Vig" price of a market maker and displays it alongside the retail odds. This allows the bettor to compare the theoretical true price against the available price without doing mental math.
Conclusion#
The sportsbook screen is not a crystal ball; it does not tell you who will win the game. Instead, it tells you something far more valuable: the price of the game.
By mastering the screen, you stop betting on sports and start betting on numbers. You learn to respect the wisdom of the market makers, exploit the sluggishness of the retail books, and time your entries to capture the best Closing Line Value (CLV). Whether you are grinding arbitrage, chasing steam, or originating your own angles, the screen is the canvas upon which your edge is painted.
Frequently Asked Questions
What is a sportsbook screen and why do pros use it?▼
What is the difference between a market maker and a retail book on a screen?▼
How do I spot 'steam' on a betting screen?▼
What are rotation numbers on a betting screen?▼
Can I use a sportsbook screen for arbitrage betting?▼
Related Articles
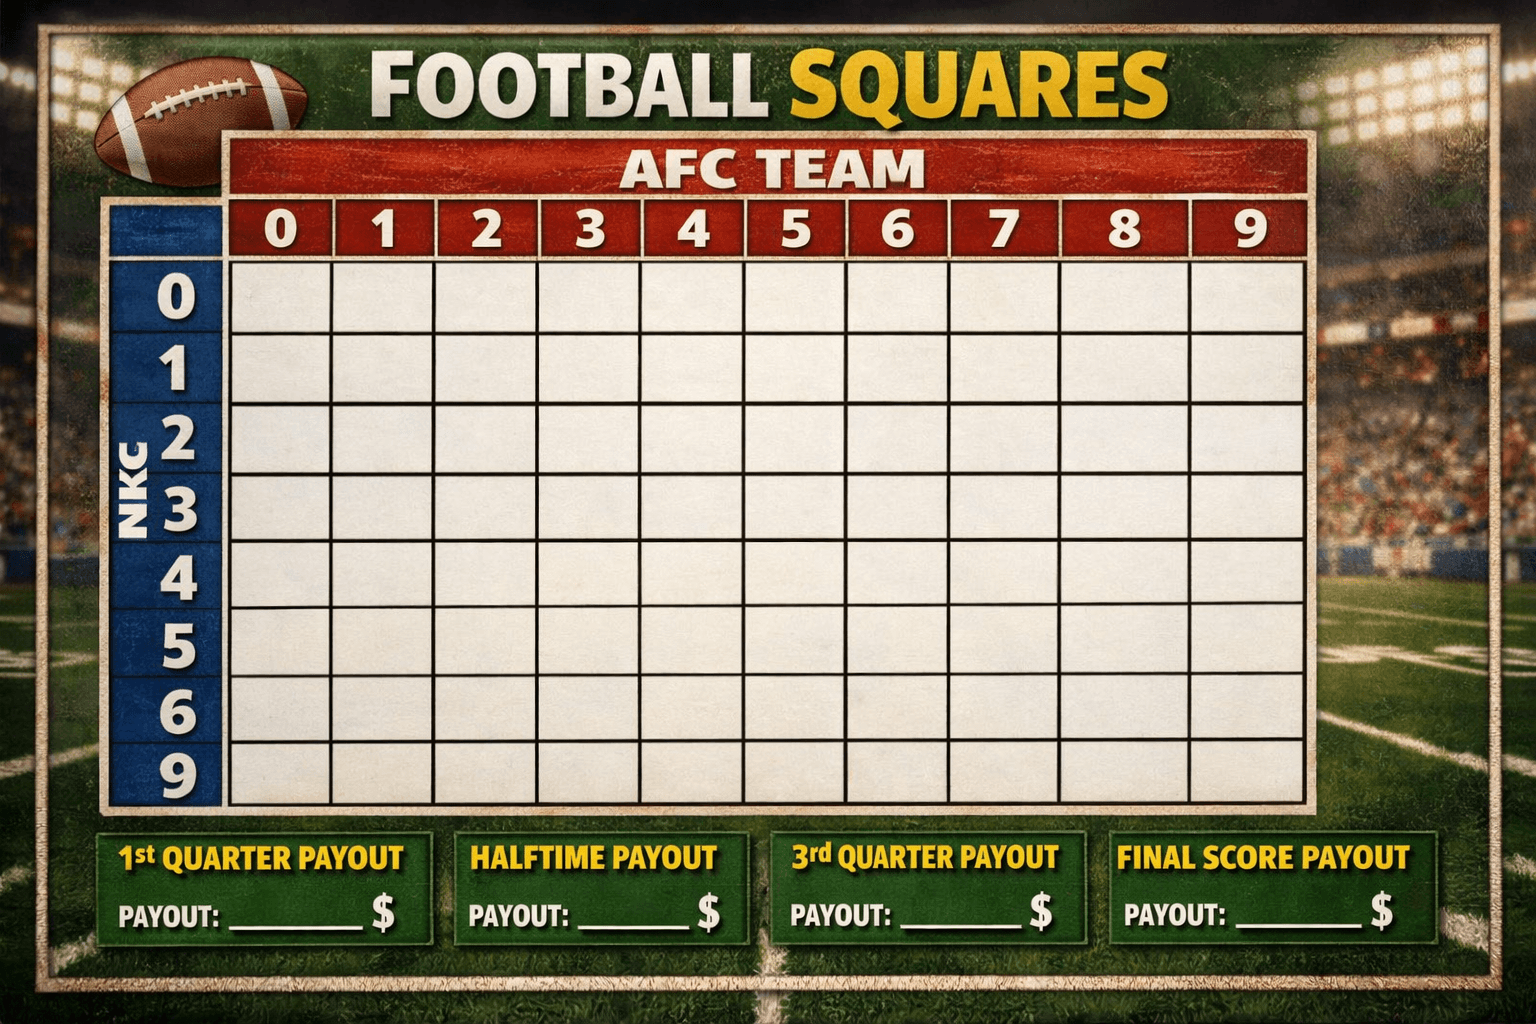
Football Squares Rules: The Definitive Analytics & Strategy Guide
Master football squares with this data-driven guide. Learn the rules, optimal number probabilities, auction valuation strategies, and how to gain an edge in high-stakes pools.
.png&w=3840&q=75)
Middling in Sports Betting: The Math Behind the Most Profitable Play
Master the art of middling. Learn how to exploit line movements to create risk-free windows where you win both sides of a bet. Advanced strategy for sharps.
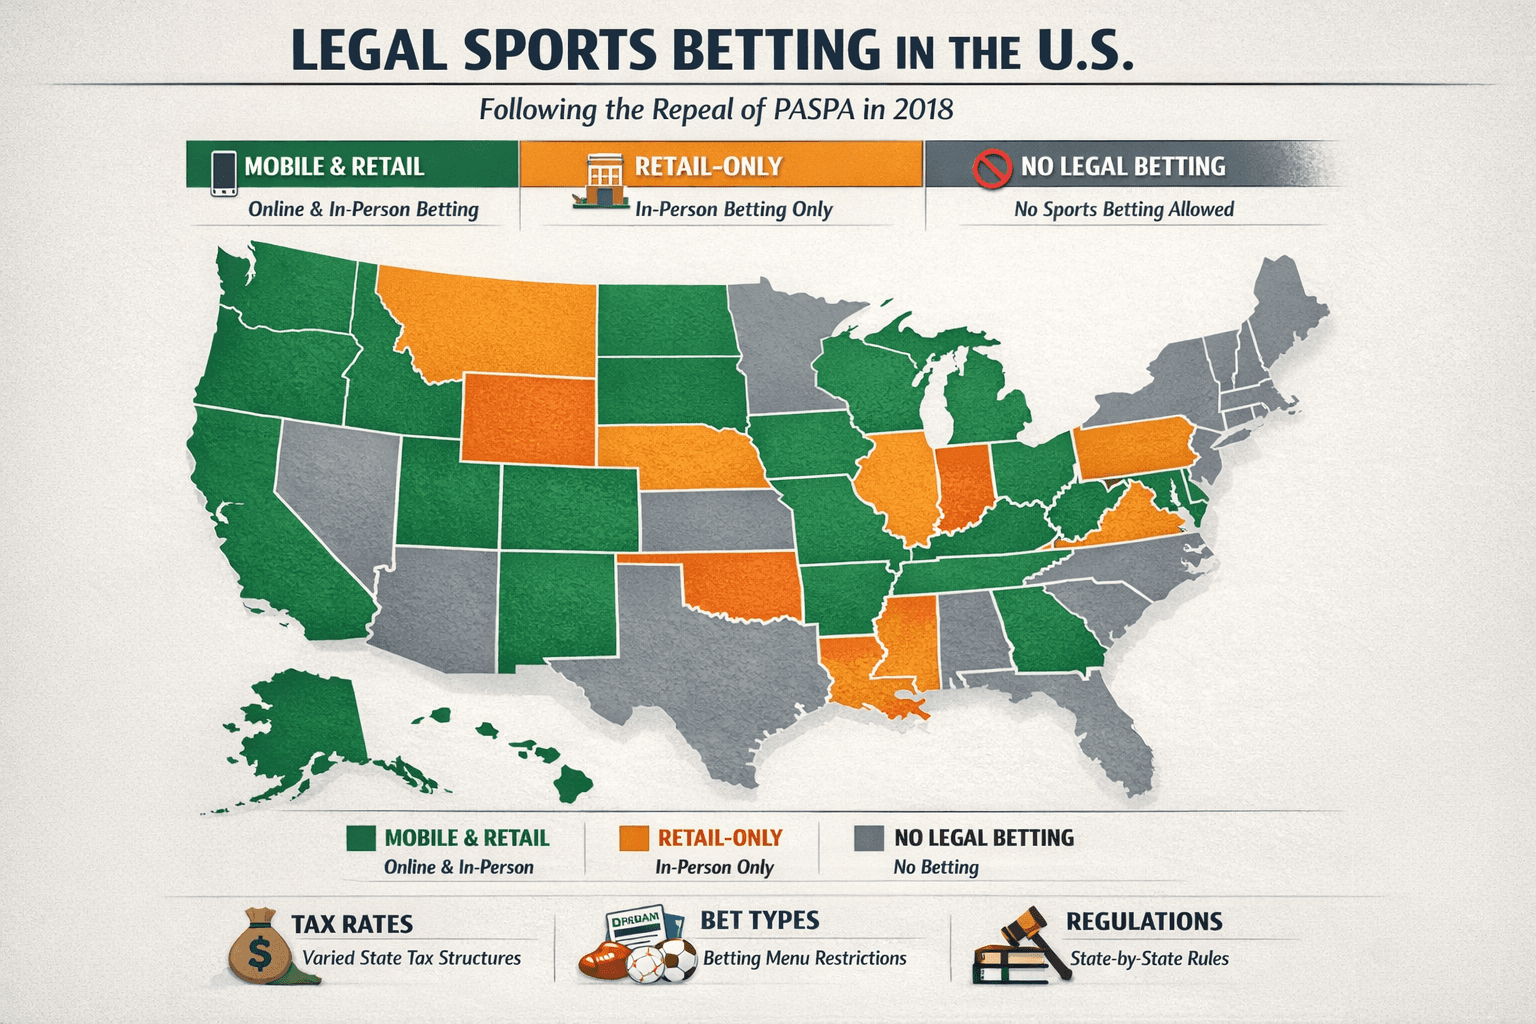
Legal Sports Betting States: 2026 Definitive Sharps Guide
The complete 2026 map of legal US sports betting. Analysis of mobile vs. retail markets, tax impact on odds, prop restrictions, and legislative forecasts.
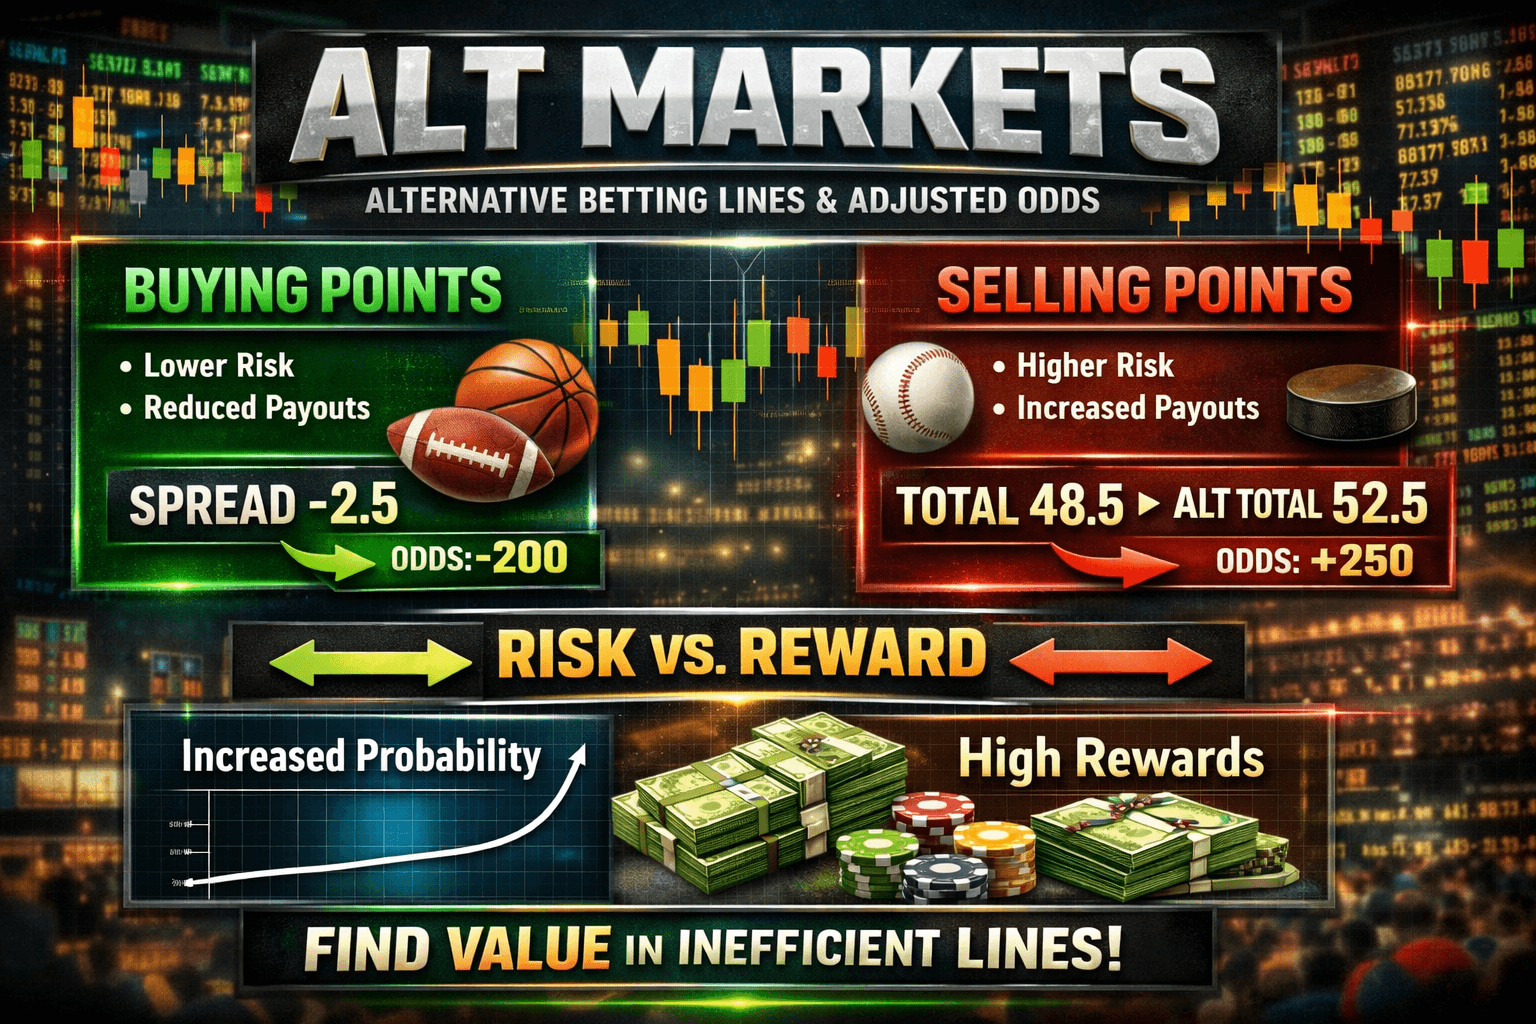
Alt Markets Explained: Exploiting Derivatives for +EV Betting
Master alternate betting markets. Learn how sharps exploit pricing inefficiencies in alt spreads, totals, and props to find edge beyond the main lines.
Ready to find your Edge?
Join thousands of smart bettors who have stopped guessing and started calculating. Access institutional-grade tools for the price of a standard wager.