What is a Quad 1 Win? The Bettor’s Guide to NCAA NET Rankings

Key Takeaways
- Location is the Differentiator: A win against the 70th-ranked team is only a Quad 1 win if it happens on the road. The system heavily weights difficulty of environment.
- Fade the Paper Tigers: Teams with high win totals but zero Quad 1 victories are often overvalued by the public against battle-tested opponents with worse records.
- Monitor Rank Volatility: Opponent rankings fluctuate daily; a 'quality' win from November can degrade into a Quad 2 or 3 win by March, altering a team's true resume value.
Definition
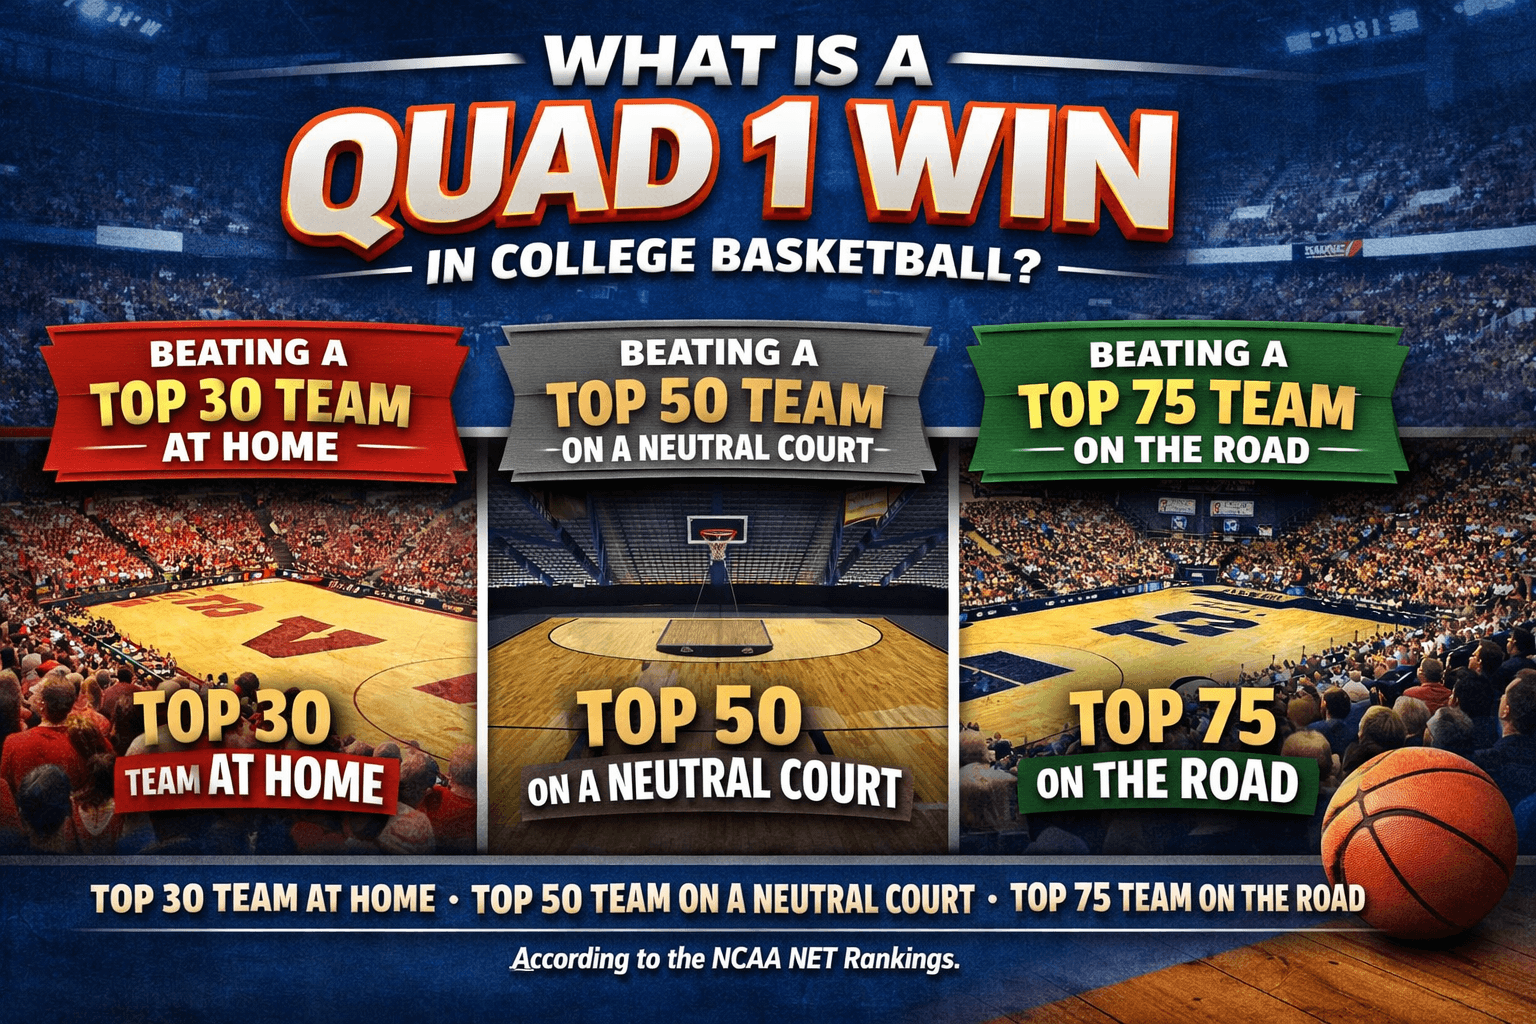
A Quad 1 win is a victory over an opponent ranked in the top tier of the NCAA Evaluation Tool (NET) rankings, adjusted for game location. Specifically, it requires beating a top-30 team at home, a top-50 team on a neutral court, or a top-75 team on the road.
Table of Contents
In the era of modern sports analytics, the raw win-loss record is a lying metric. For the sophisticated bettor, a 25-win team in a weak conference is often less dangerous than an 18-win team surviving the gauntlet of the Big 12.
The NCAA Tournament Selection Committee knows this. That is why, in 2018, they abandoned the archaic RPI (Ratings Percentage Index) in favor of the NET (NCAA Evaluation Tool). At the heart of this system lies the concept of the Quad 1 Win.
For the general public, "Quad 1" is just buzzword bingo heard during March Madness bracketology segments. For the sharp bettor, understanding the quadrant system is essential for handicapping motivation, predicting line movement, and identifying teams that the market has fundamentally overvalued or undervalued.
Deconstructing the NET Rankings#
Before defining the quadrants, you must understand the engine driving them: the NET. The RPI was flawed because it relied too heavily on who you played rather than how you played them. It could be gamed by scheduling "good" bad teams.
The NET is a predictive and results-based hybrid model. While the NCAA keeps the exact algorithm proprietary to prevent coaches from mathematically gaming the system during garbage time, we know it relies heavily on two primary factors:
- Team Value Index (TVI): An algorithm that rewards beating quality opponents. It’s results-oriented.
- Net Efficiency: This measures offensive and defensive efficiency (points per possession) adjusted for the strength of the opponent and game location.
This shift toward efficiency aligns the selection committee with the same metrics that oddsmakers use.
The Quadrant System: It’s All About Location#
The defining feature of the quadrant system is the location adjustment. Beating the #35 ranked team is not a uniform achievement. Doing it at home is expected; doing it on the road is elite.
The NET rankings (1 through 362) are sliced into four quadrants based on the opponent's rank and where the game is played.
Quadrant 1 (The Gold Standard)
These are the resume-defining victories. A high volume of Q1 wins is the primary differentiator between a #1 seed and a bubble team.
- Home: vs. NET 1–30
- Neutral: vs. NET 1–50
- Away: vs. NET 1–75
Quadrant 2 (Solid Wins)
These wins prove competence. They don't necessarily raise a team's ceiling, but they stabilize the floor.
- Home: vs. NET 31–75
- Neutral: vs. NET 51–100
- Away: vs. NET 76–135
Quadrant 3 (The Danger Zone)
For elite teams, these are "hold serve" games. A win here helps very little; a loss here (a "bad loss") is catastrophic for seeding.
- Home: vs. NET 76–160
- Neutral: vs. NET 101–200
- Away: vs. NET 136–240
Quadrant 4 (Resume Killers)
These are the "buy games" or bottom-feeder conference matchups.
- Home: vs. NET 161+
- Neutral: vs. NET 201+
- Away: vs. NET 241+
Why the "Away" Adjustment Matters for Bettors#
Notice the disparity in Quadrant 1. You can beat the 74th-ranked team on the road and get credit for a Q1 win, but beating the 31st-ranked team at home is only Q2.
This mathematical acknowledgment of Home Court Advantage (HCA) is vital. The committee is essentially saying that the difficulty of winning on the road against a top-75 team is equivalent to beating a top-30 team at home.
The Betting Angle: Public bettors often look at rankings in a vacuum. They see Team A (Ranked 15th) playing Team B (Ranked 60th) and assume a blowout. However, if Team B is at home, the efficiency metrics suggest a much tighter contest. The quadrant boundaries explicitly quantify the HCA valuation that you should be applying to your spread handicapping.
How to Handicap Using Quadrant Data#
Data-driven bettors use quadrant records to filter out the noise of raw win-loss records. Here is how to apply this to your handicap.
1. Fade the "Paper Tigers" (High Win Total, Low Q1)
Every year, there are mid-major teams (or soft schedule Power 6 teams) sitting at 23-4. The public sees "23 wins" and bets them. However, if they are 0-2 in Q1 games and 18-0 in Q4 games, their record is inflated. When these teams face a battle-tested opponent with a seemingly worse record (e.g., 17-10 but with four Q1 wins), the "Paper Tiger" is often overvalued by the spread.
2. The "Bubble Desperation" Factor
In late February and early March, motivation becomes a massive variable. Teams sitting on the "bubble" (the edge of tournament inclusion) need Q1 wins desperately.
When a bubble team plays a highly ranked team that has already locked up its seeding, the motivation gap is real. The bubble team is playing for their life; the elite team is playing not to get injured. If the underdog is at home, this is a prime spot to check the Line Shopper to find the best price on the moneyline or spread. The market often prices the superior talent but ignores the desperation factor.
3. Volatility of the Metric
NET rankings change daily. A win that is "Quad 1" today might become "Quad 2" tomorrow if the opponent slides down the rankings.
Sharps monitor "future degradation." If a team has five Q1 wins, but three of those opponents are dealing with injuries and losing streaks, those wins are depreciating assets. The market perception of the team remains high ("They have 5 Q1 wins!"), but the actual quality of their resume is crumbling. This creates value in fading them.
4. Quadrant 1 Wins vs. Predictive Metrics
There is often a disconnect between a team's resume (Quad 1 wins) and their predictive power (KenPom or BartTorvik ratings).
- Resume: What you have done (backward-looking).
- Predictive: What you are likely to do (forward-looking).
A team might simply be "lucky" in close games, accruing Q1 wins despite mediocre efficiency stats. These are prime regression candidates. If a team has a high number of Q1 wins but a lower Net Efficiency rating, they are likely winning coin-flip games—a trend that is statistically unlikely to sustain itself in the long run.
The "Q1A" Distinction#
While not an official NCAA designation, bracketologists and analysts often subdivide Quadrant 1 into Q1A (the elites) and Q1B.
- Q1A: The top tier of Q1 (e.g., top 15 home, top 25 neutral, top 40 away).
- Q1B: The lower tier of Q1.
When handicapping the National Champion futures market, look for Q1A dominance. It is rare for a team to win the NCAA tournament without a proven track record of beating elite competition away from home.
Summary#
The Quad 1 win is the currency of college basketball. For the Selection Committee, it determines access to the tournament. For the sports bettor, it serves as a litmus test for a team's true ceiling.
Stop looking at the AP Poll. Stop looking at raw win totals. Start looking at performance in the quadrants. That is where the edge lies.
Frequently Asked Questions
What exactly qualifies as a Quad 1 win?▼
Does the margin of victory matter for NET rankings?▼
How often are NET rankings updated?▼
Why is the NET better than RPI for bettors?▼
Can a loss be a Quad 1 game?▼
Related Articles
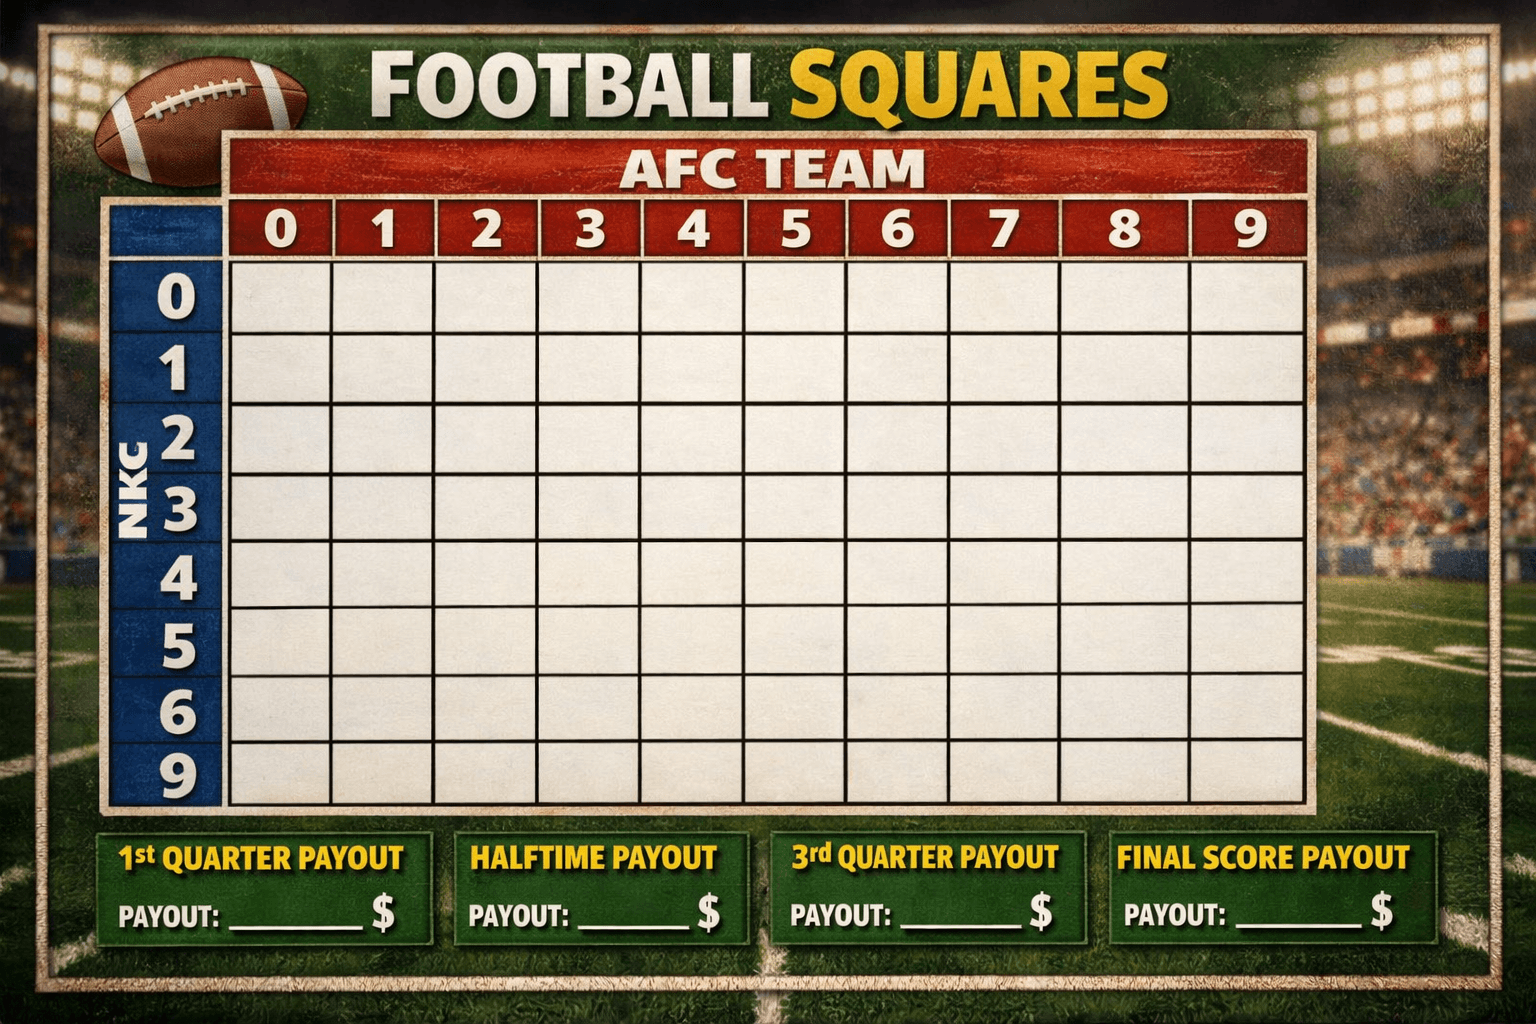
Football Squares Rules: The Definitive Analytics & Strategy Guide
Master football squares with this data-driven guide. Learn the rules, optimal number probabilities, auction valuation strategies, and how to gain an edge in high-stakes pools.
.png&w=3840&q=75)
Middling in Sports Betting: The Math Behind the Most Profitable Play
Master the art of middling. Learn how to exploit line movements to create risk-free windows where you win both sides of a bet. Advanced strategy for sharps.
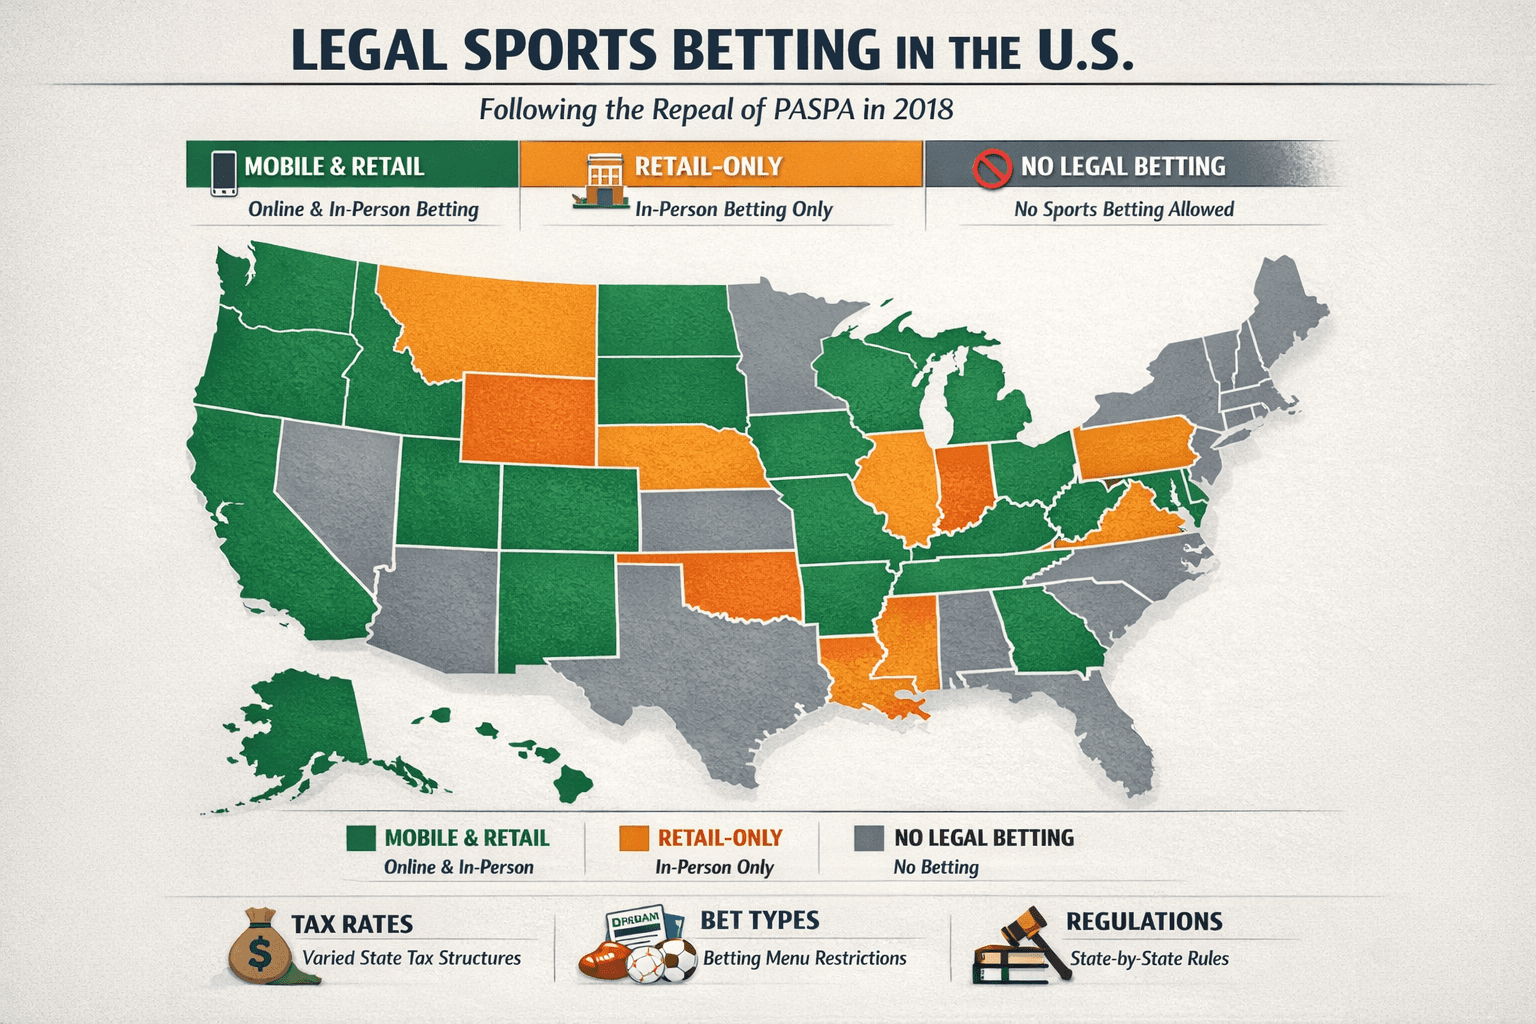
Legal Sports Betting States: 2026 Definitive Sharps Guide
The complete 2026 map of legal US sports betting. Analysis of mobile vs. retail markets, tax impact on odds, prop restrictions, and legislative forecasts.
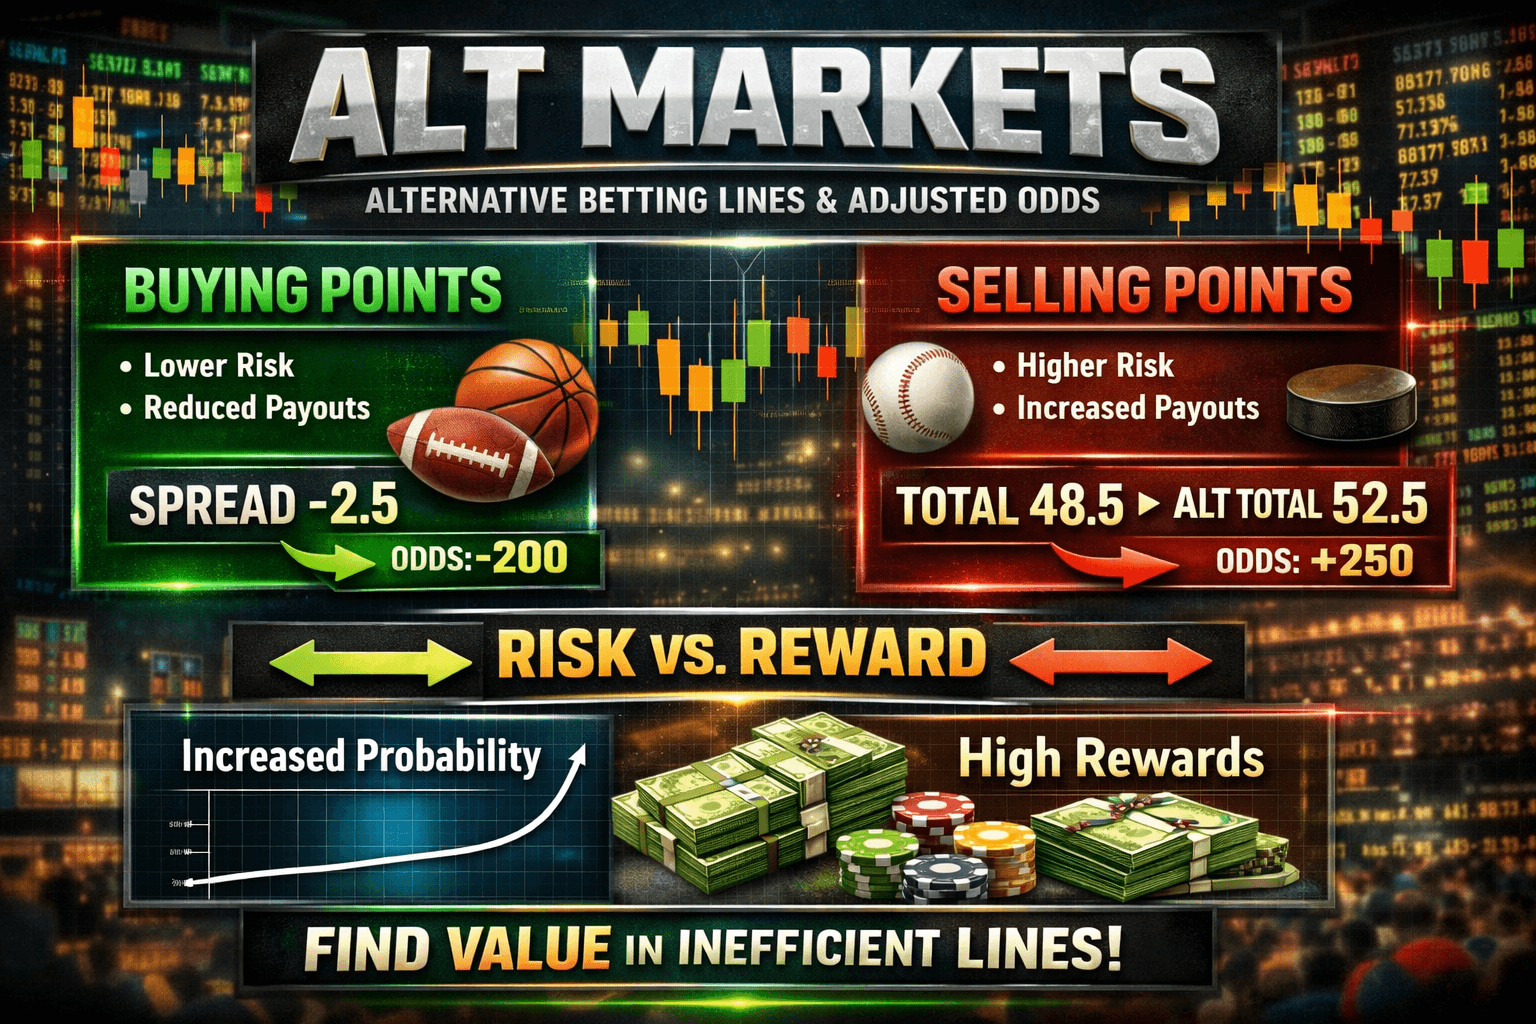
Alt Markets Explained: Exploiting Derivatives for +EV Betting
Master alternate betting markets. Learn how sharps exploit pricing inefficiencies in alt spreads, totals, and props to find edge beyond the main lines.
Ready to find your Edge?
Join thousands of smart bettors who have stopped guessing and started calculating. Access institutional-grade tools for the price of a standard wager.