Win Probability Explained: Calculating True Odds & The Edge

Key Takeaways
- Implied vs. True Probability: Sportsbook odds represent implied probability (which includes fees), not the actual likelihood of winning. Calculating the 'True Win Probability' by removing this fee is the first step to finding value.
- De-Vigging is Essential: To find the fair market price, you must remove the 'vig' or 'juice' from sharp bookmaker lines. This reveals the market consensus on the actual win probability.
- Variance is Inevitable: A high win probability (e.g., 65%) still implies a 35% chance of losing. Sharp bettors focus on the price paid relative to the probability, not just the game's outcome.
- Live Betting Volatility: In-game win probability fluctuates drastically based on game state. Capitalizing on sportsbooks that are slow to update their live probabilities offers significant +EV opportunities.
- Bankroll Sizing: Accurate win probability inputs are required for the Kelly Criterion, which dictates the optimal bet size to maximize growth and minimize ruin.
Definition
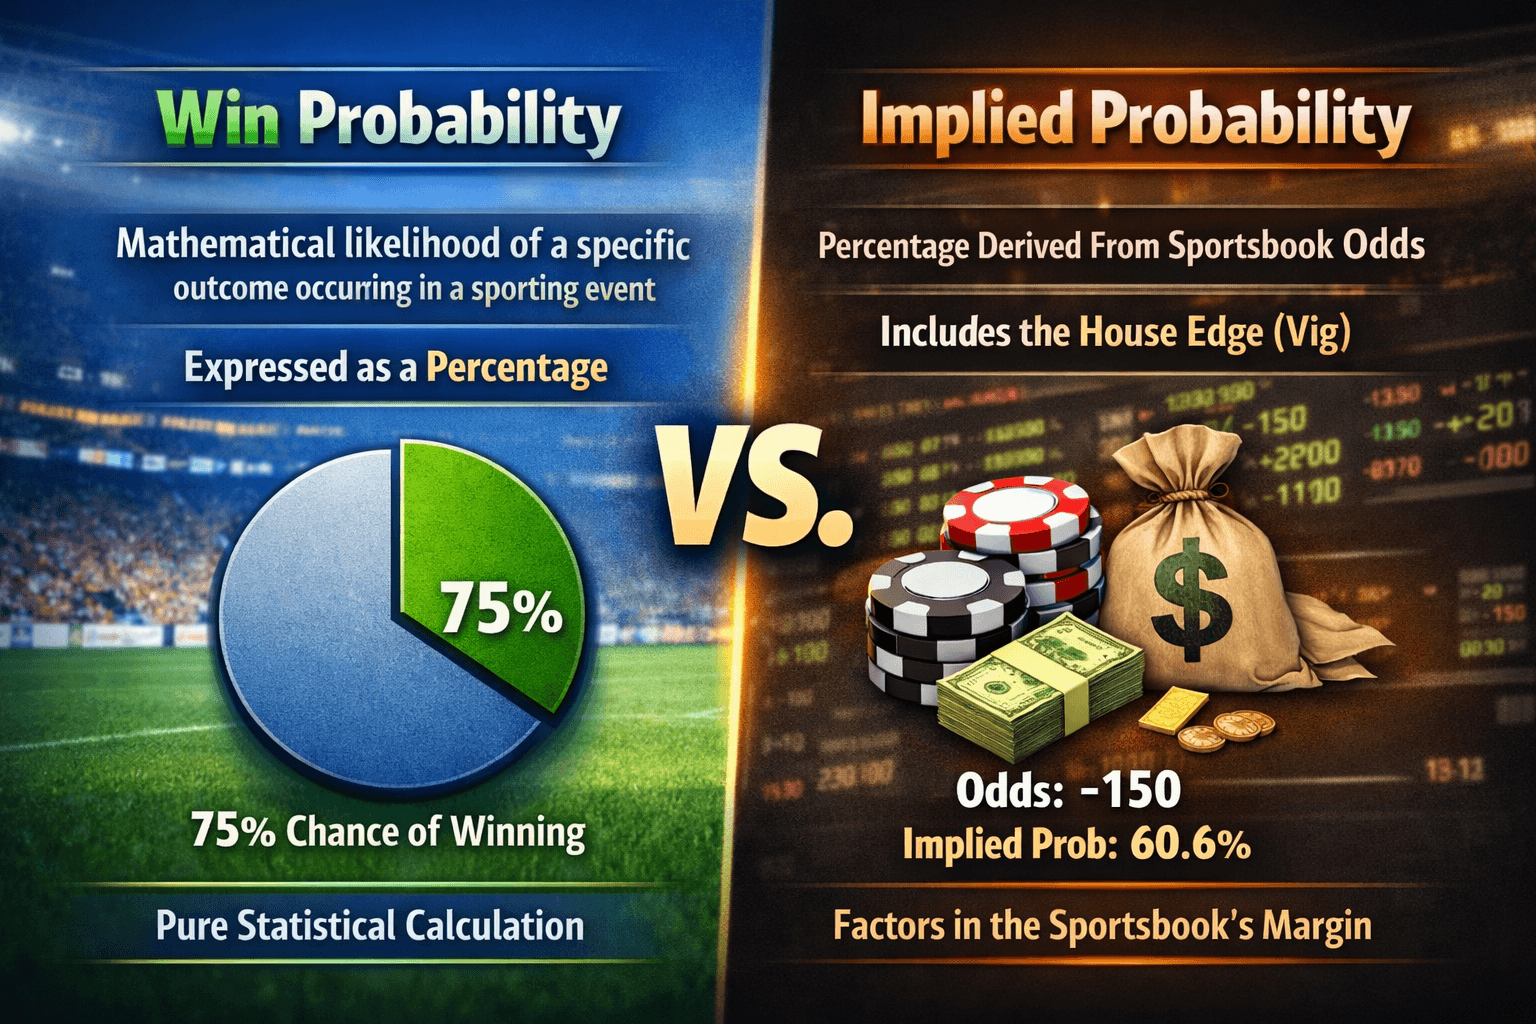
Win Probability is the mathematical likelihood of a specific outcome occurring in a sporting event, expressed as a percentage. In sports betting, it is distinct from "implied probability," which is the percentage derived from sportsbook odds that includes the house edge (vig).
Table of Contents
In the world of professional sports betting, the question isn't "Who do you think will win?" That is a question for fans and casuals. The question a sharp bettor asks is, "What is the true probability of this outcome compared to the price offered?"
If you cannot accurately estimate win probability, you are essentially flying blind. You might be picking winners, but you are likely paying a premium that erodes your bankroll over time. Understanding the distinction between the odds you see on the screen and the actual likelihood of an event is the single most important skill in handicap betting.
This guide moves beyond basic odds conversion. We will break down how to calculate true win probability, how to strip away the sportsbook's "vig," and how to build a process that identifies when the market is wrong.
The Fundamental Disconnect: Implied vs. True Probability#
To understand win probability, we must first understand the mechanism of the market. Sportsbooks do not sell probabilities; they sell priced risks. The odds they display—whether American (-110), Decimal (1.91), or Fractional (10/11)—represent the Implied Probability.
Implied Probability is the break-even percentage required for a bet to be profitable over the long run at those specific odds.
Calculating Implied Probability
The math to convert American odds to a percentage is straightforward:
-
Negative Odds (Favorites): Example: For -150 odds: $150 / (150 + 100) = 0.60$ or 60%.
-
Positive Odds (Underdogs): Example: For +130 odds: $100 / (130 + 100) = 0.4348$ or 43.5%.
However, if you sum the implied probabilities of all possible outcomes in a match (e.g., Team A to win + Team B to win), you will almost always get a number greater than 100%. This excess is the Overround (or "Vig" or "Juice"). It is the tax the sportsbook charges to facilitate the wager.
True Win Probability, conversely, is the actual, objective likelihood of the outcome occurring, stripped of that tax. Your goal as a bettor is simple but difficult: Find instances where your calculated True Win Probability is higher than the sportsbook's Implied Probability. This gap is your Edge.
De-Vigging: Finding the "Fair" Price#
The quickest way to estimate the market consensus for True Win Probability is to "de-vig" the lines from the sharpest sportsbooks in the world.
Bookmakers like Pinnacle or Circa Sports are known for high limits and accepting sharp action. Their lines are considered the "source of truth" because they are molded by the smartest bettors in the market. By removing the vig from their lines, we can see what the market believes the actual chance of winning is.
The Power of No-Vig Probability
Let's say a sharp book has the following line for an NFL game:
- Kansas City Chiefs: -125
- Buffalo Bills: +105
- Calculate Implied Probabilities:
- Chiefs (-125): $55.56%$
- Bills (+105): $48.78%$
- Total Market Percentage: $55.56 + 48.78 = 104.34%$
- The Overround: $4.34%$
To find the "Fair" or "No-Vig" probability, we normalize these percentages so they sum to exactly 100%.
- Chiefs True Win Probability: $55.56 / 1.0434 \approx 53.25%$
- Bills True Win Probability: $48.78 / 1.0434 \approx 46.75%$
Now, if you find a recreational sportsbook (a "soft" book) offering the Chiefs at -105, the implied probability of that bet is 51.22%.
Because your calculated True Win Probability (53.25%) is higher than the soft book's Implied Probability (51.22%), you have a Positive Expected Value (+EV) bet.
This manual calculation is tedious to do for every game. This is why tools like our No Vig Calculator are essential for rapid analysis, and why our Live +EV Feed automates this process by scanning thousands of lines instantly to find these discrepancies.
Building Your Own Probability Models#
While "market-making" (copying sharp books) is effective, the elite tier of bettors often originate their own numbers. This involves building statistical models to generate a Win Probability independent of the betting market. If your model is sharper than the market, you print money.
1. Elo and Power Ratings
The simplest form of probability modeling relies on Power Ratings. Systems like Elo (originally for Chess, now adapted for NFL/NBA via FiveThirtyEight and others) assign a rating number to every team. The difference in ratings between two teams, adjusted for home-field advantage, can be converted directly into a win probability.
- Pros: Easy to maintain; accounts for strength of schedule.
- Cons: Often slow to react to injuries or sudden roster changes; "historical" data doesn't always predict future performance.
2. Regression Analysis & Monte Carlo Simulations
More advanced models use regression analysis to identify which metrics correlate most strongly with winning (e.g., EPA/Play in football, eFG% in basketball).
Once you have projected stats for a matchup, you can run a Monte Carlo Simulation. This involves simulating the game 10,000+ times using randomized variables based on your projected stats.
- Scenario: If the simulation shows the Celtics beating the Knicks in 6,200 out of 10,000 runs, your model's Win Probability for Boston is 62%.
- Action: If the market offers Boston at -140 (58.3% implied), your model suggests an edge.
3. Poisson Distribution (Soccer/Hockey)
For low-scoring sports, the Poisson Distribution is the gold standard. It calculates the probability of a variable number of events (goals) occurring in a fixed time interval.
By calculating each team's "Expected Goals" (xG) based on attack and defense strength, you can calculate the exact percentage chance of every possible scoreline (1-0, 2-1, 0-0, etc.) and sum them up to get the Match Win Probability.
In-Game Win Probability: The Live Betting Frontier#
Pre-game probability is static. In-game (Live) probability is a chaotic, dynamic beast. This is where the modern "arms race" in sports betting is taking place.
Live Win Probability models must digest real-time data feeds—down and distance, time remaining, possession, current score—and update probabilities instantly.
The Decay of Uncertainty
As a game progresses, variance decreases.
- Start of Game: Win Probability is based largely on pre-game priors (who is the better team?).
- End of Game: Win Probability is based almost entirely on the current game state (who has the points?).
The transition between these two states is where opportunity lives. If a heavy favorite goes down 7-0 early, their live win probability might drop from 75% to 60%. However, a novice bettor might panic and think the underdog is now favored. A good live model knows that a 7-point deficit in the 1st quarter is not the same as a 7-point deficit in the 4th quarter.
Using a Live +EV Feed during games allows you to catch sportsbooks that are lazy with their algorithm updates. If the book's algorithm overreacts to an interception, but the true win probability hasn't shifted that drastically, you can snipe the line before it corrects.
The Psychology of Probability: Variance and Luck#
Even if you have the perfect Win Probability model, you will lose. Frequently.
A 60% win probability means you will lose 40% of the time. In a 10-game sample, it is entirely statistically normal for a 60% favorite to lose 6 or 7 times. This is Variance.
Thinking in Ranges, Not Absolutes
Novice bettors think in binaries: "Will they win or not?" Sharp bettors think in distributions: "They win this game 55% of the time. The market says 50%. The bet is a buy."
If you judge your success solely on the outcome of the game (Result-Oriented Thinking), you will abandon winning strategies during downswings and chase losing strategies during upswings. You must judge your success on the Closing Line Value (CLV)—did you bet a team at a price better than the true probability?
Integrating Win Probability into Your Bankroll Management#
Knowing the true win probability does more than just tell you what to bet; it tells you how much to bet.
This is the domain of the Kelly Criterion. The Kelly formula uses your calculated edge to determine the optimal stake size to maximize bankroll growth while minimizing the risk of ruin.
Where:
- is the fraction of the bankroll to wager.
- is the decimal odds - 1.
- is the probability of winning (Your calculated True Win Probability).
- is the probability of losing ($1 - p$).
If your Win Probability calculation is accurate, Kelly will tell you to bet more on big edges and less on small ones. If your calculation is wrong, Kelly will bankrupt you. This is why many pros use "Fractional Kelly" (betting half or a quarter of the recommended size) to account for model error.
Summary#
Win Probability is the engine of profitable betting. It is the metric that separates gambling from investing.
- De-code the Odds: Convert American odds to implied percentages.
- Remove the Juice: Use No-Vig calculators to find the market consensus.
- Model the Game: Use data, not gut feeling, to project your own probabilities.
- Hunt the Edge: Only bet when True Probability > Implied Probability.
The market is efficient, but it is not perfect. It cracks under the weight of public bias, injury news overreactions, and lazy algorithmic updates. Armed with accurate win probability, you are the one holding the hammer.
Frequently Asked Questions
What is the difference between implied probability and true win probability?▼
How do you calculate win probability from American odds?▼
What is 'de-vigging' a betting line?▼
Can you use win probability for live betting?▼
How does the Kelly Criterion use win probability?▼
Related Articles
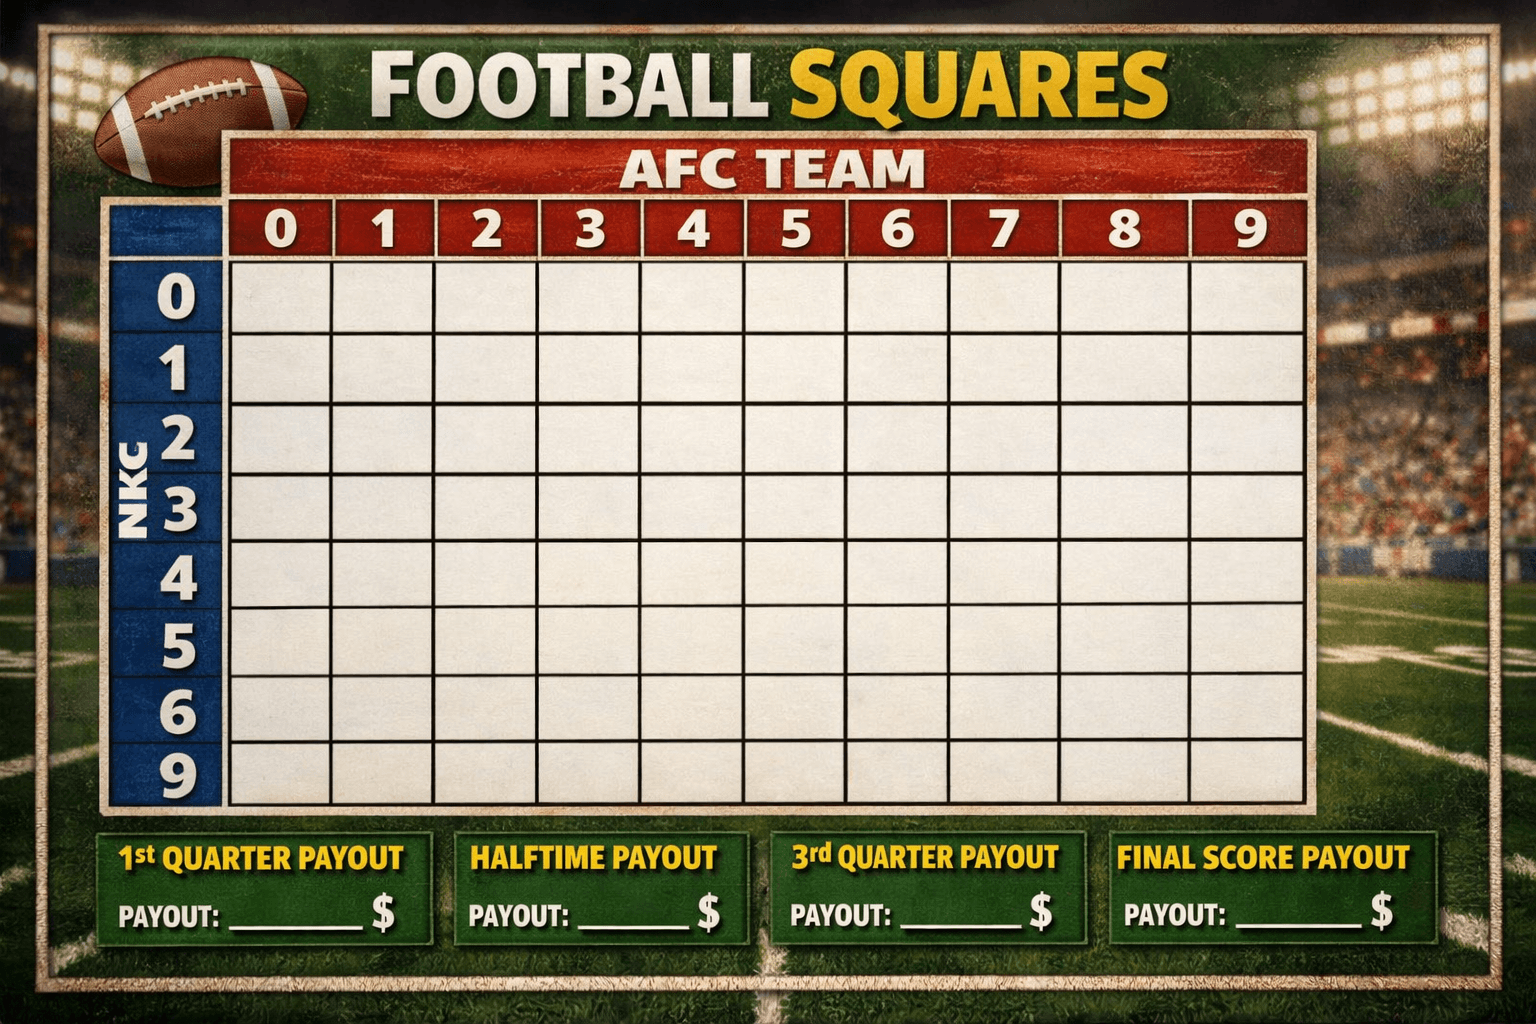
Football Squares Rules: The Definitive Analytics & Strategy Guide
Master football squares with this data-driven guide. Learn the rules, optimal number probabilities, auction valuation strategies, and how to gain an edge in high-stakes pools.
.png&w=3840&q=75)
Middling in Sports Betting: The Math Behind the Most Profitable Play
Master the art of middling. Learn how to exploit line movements to create risk-free windows where you win both sides of a bet. Advanced strategy for sharps.
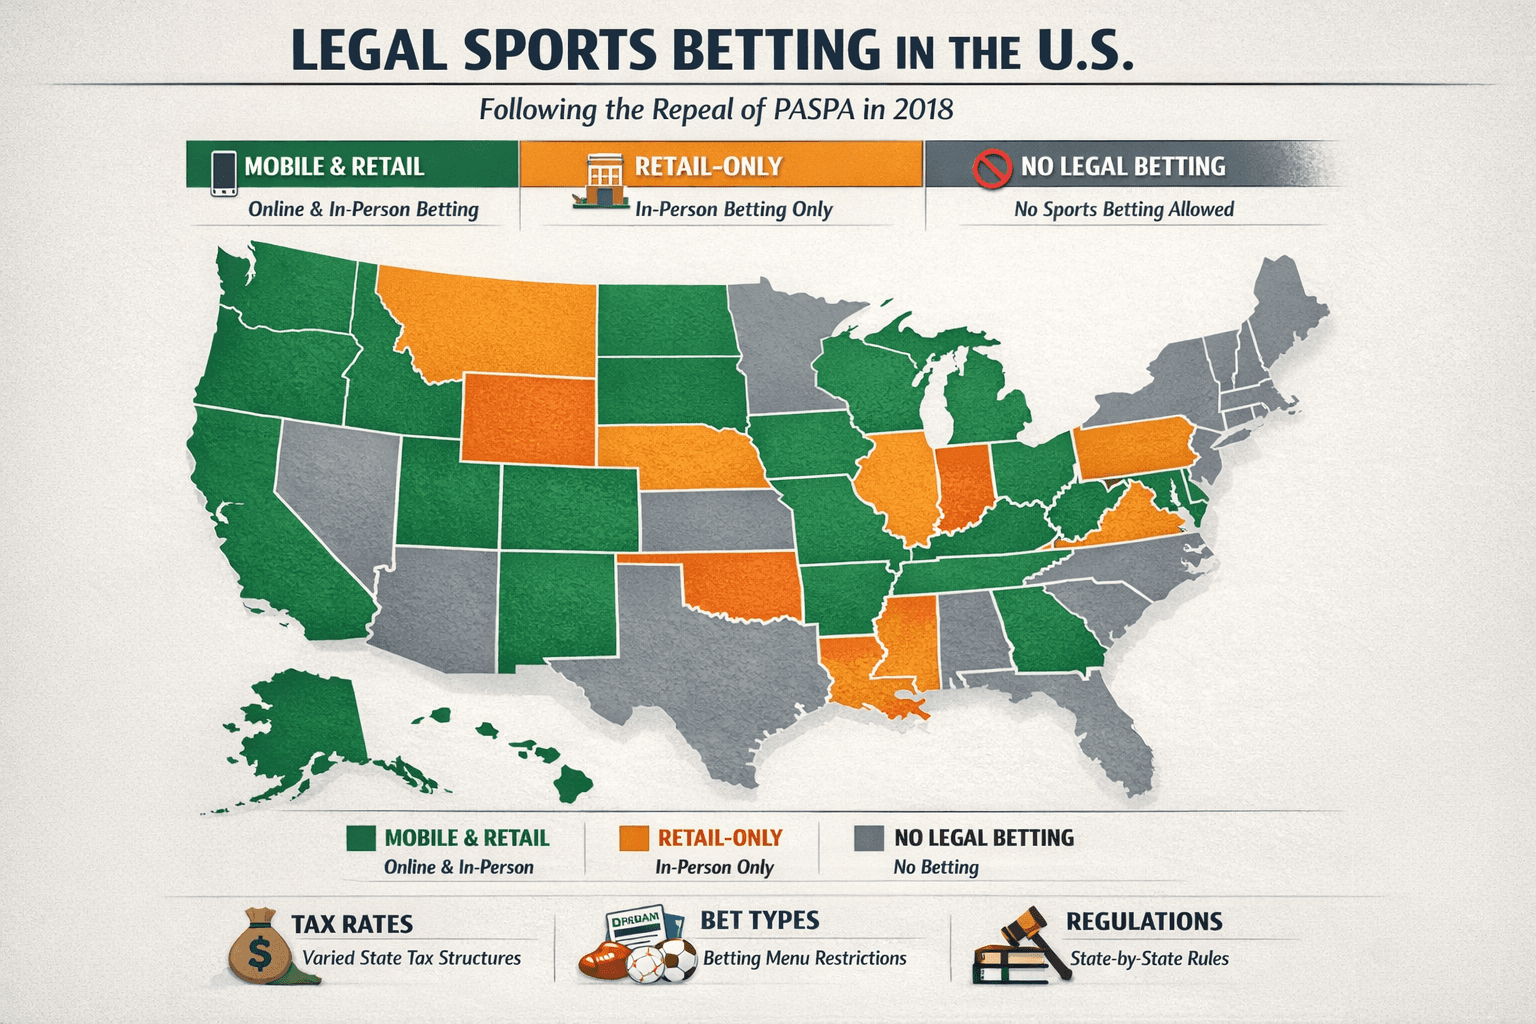
Legal Sports Betting States: 2026 Definitive Sharps Guide
The complete 2026 map of legal US sports betting. Analysis of mobile vs. retail markets, tax impact on odds, prop restrictions, and legislative forecasts.
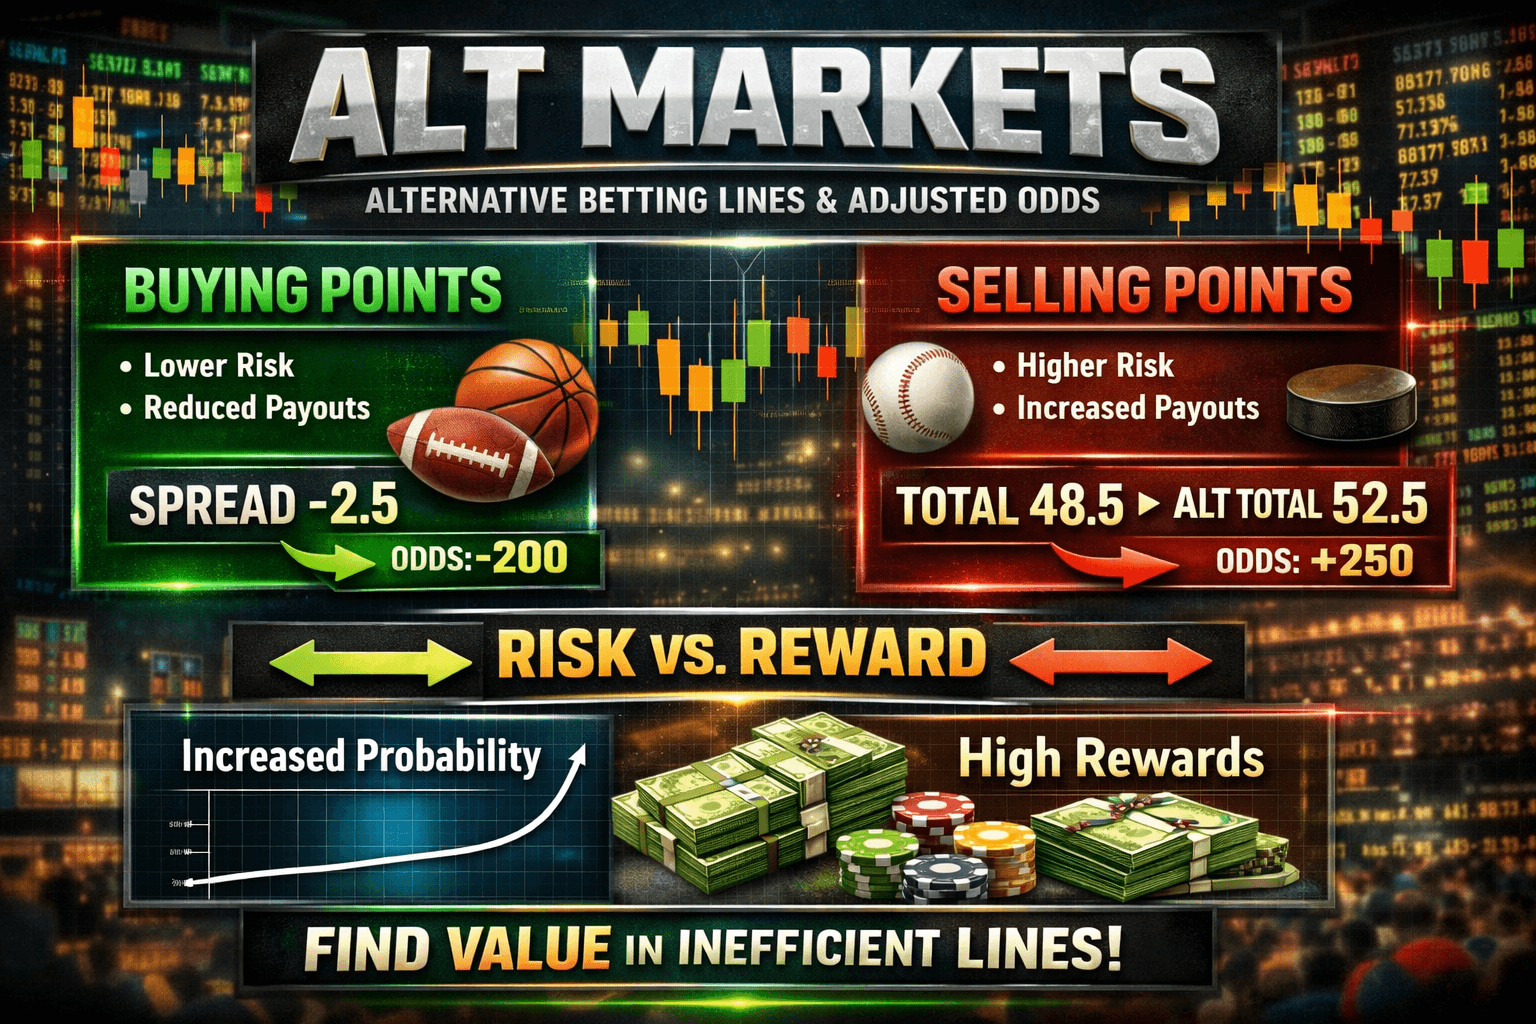
Alt Markets Explained: Exploiting Derivatives for +EV Betting
Master alternate betting markets. Learn how sharps exploit pricing inefficiencies in alt spreads, totals, and props to find edge beyond the main lines.
Ready to find your Edge?
Join thousands of smart bettors who have stopped guessing and started calculating. Access institutional-grade tools for the price of a standard wager.